










![3D Explainer Video - ScribbleLive.mp4_snapshot_00.12_[2022.03.09_03.14.16]](https://increditors.com/wp-content/uploads/elementor/thumbs/3D-Explainer-Video-ScribbleLive.mp4_snapshot_00.12_2022.03.09_03.14.16-r7wb53mx72rxst3qcqyrfxdmeyzb5r9jbl0wbjujh4.png "3D Explainer Video – ScribbleLive.mp4_snapshot_00.12_[2022.03.09_03.14.16]")
































B2B YouTube benchmarks look nothing like platform averages. A business channel with 200 views per video and 40–55% retention is outperforming most peers in its category — while a gaming channel with those same numbers would be failing. This guide translates raw platform data into B2B-specific planning ranges for views, subscriber growth, CTR, and audience retention, so you can set honest goals and stop measuring your pipeline channel against MrBeast. For adjacent context, compare this with our ideal video length by platform guide and our YouTube Shorts strategy for B2B.
- Why B2B YouTube Benchmarks Differ from Platform Averages
- B2B YouTube Views: What “Good” Actually Looks Like
- Subscriber Growth Rates for B2B Channels
- Click-Through Rate (CTR) on B2B YouTube
- Audience Retention: The Metric That Actually Moves Pipeline
- Lead Signals: What Benchmarks Don’t Show You
- How to Use These Benchmarks as a B2B Marketing Team
- FAQ
- Verdict
Why B2B YouTube Benchmarks Differ from Platform Averages
The platform-wide benchmarks most articles quote are almost completely irrelevant for a B2B marketing channel. Not because the data is wrong, but because it pools an absurdly heterogeneous mix: gaming channels, beauty creators, music videos, cooking tutorials, and enterprise software walkthroughs all lumped into one average. If your CMO is asking why your latest product demo got 180 views, pointing to a platform average of 687 views per video — the headline finding from Metricool’s analysis of 82,000 accounts and 7.3 million videos — gives exactly the wrong picture.
The 76% surge in average views that study documents was driven almost entirely by two forces that have nothing to do with B2B content: the explosion of YouTube Shorts, which now generate roughly 70 billion daily views globally, and the rapid growth of passive smart TV viewing. Neither audience segment is sitting in front of their screen ready to book a demo, evaluate a software subscription, or approve a vendor contract. They’re watching a 45-second Shorts clip while commuting. For B2B teams, those views are noise.
The Shorts Distortion
When the Metricool study found that overall platform engagement rate dropped 37% — falling from approximately 3.73% to 2.34% — while views surged, that’s the Shorts distortion in action. The platform is reaching far more people, but a much larger share of that audience is passive and low-intent. For a B2B marketer publishing in-depth product walkthroughs, thought leadership interviews, or customer story videos, low engagement rates on platform-wide aggregates are a red herring. Your audience self-selects. The person who watches a 10-minute explainer on your software category is a completely different viewer profile than someone who scrolled into a viral Shorts clip.
B2B Audiences Are Smaller, Not Weaker
The addressable audience for a B2B YouTube channel is structurally smaller. A cybersecurity software company targeting enterprise IT directors is not competing for the same pool of viewers as a cooking channel or a fitness influencer. That smaller pool does not mean the channel is underperforming — it means the channel needs fundamentally different benchmarks. A business channel generating 200 views per video may be reaching precisely the right 200 decision-makers, every single time. According to research published by Humble&Brag, who track B2B channel performance across dozens of client launches, a B2B SaaS company generating 200 views per video is likely performing in the top 30 percent of new business channels in its category. That reframe changes everything about how you report to leadership.
B2B YouTube Views: What “Good” Actually Looks Like
Directional view benchmarks for B2B channels depend heavily on channel size, content type, and primary traffic source. The ranges below are planning benchmarks drawn from published agency data and cross-referenced with platform behavior — not guarantees, and not applicable to every niche. Treat them as calibration tools, not KPIs to hit exactly.
Views Per Video by Channel Stage
For a B2B channel in its first 12 months publishing primarily long-form content (5 to 20-minute videos), here is the directional landscape based on publicly available agency benchmarks. Channels under 5,000 subscribers typically see 100 to 400 views per video in the first 48 hours, with search-driven content often sustaining steady trickle traffic for months after. The 48-hour window is not the full story for B2B: evergreen educational content, product walkthroughs, and how-to videos frequently accumulate most of their views through search over 90 to 180 days, not through the algorithm’s initial push.
These ranges are directional planning benchmarks, not guarantees. Your actual numbers will shift based on how search-optimized your titles are, whether you promote videos through email or LinkedIn, and whether your audience is niche (enterprise IT) or broader (general marketing). The ranges also assume consistent publishing; channels with irregular upload schedules often sit at the low end even as their subscriber base grows.
The 48-Hour Window Is Not the Whole Story
For B2B channels, the first 48 hours of a video’s life are often the least representative period. A consumer entertainment channel lives or dies in the algorithm’s initial push window. A B2B educational channel publishing a “how to migrate from [software] to [software]” walkthrough may get 90 views on day one and 4,000 views over the following 18 months as that search query finds it. YouTube Studio’s Traffic Source data is your best guide: if 60–80% of your views come from YouTube Search rather than Suggested Videos, you’re building a search-compounding library, not chasing algorithmic virality. For B2B, that’s usually the right strategy.
💡 Pro Tip: Pull your Traffic Source breakdown from YouTube Studio before your next leadership report. If Search is your top driver, a “low” view count in the first week is misleading — the video may be accumulating compounding search traffic for months. Benchmark against your own channel’s 90-day averages, not the first 48 hours.
Subscriber Growth Rates for B2B Channels
Subscriber count is the vanity metric that marketing teams most commonly use incorrectly. A B2B channel with 3,500 subscribers that drives 12 demo requests per quarter is more valuable than a B2B channel with 35,000 subscribers and zero pipeline attribution. That said, subscriber growth rate matters as a channel health signal — not as a primary success metric. Here are the planning ranges most commonly cited in the creator analytics community.
Monthly Growth Rate Targets
According to growth benchmarks published by Ventress.app in 2025, a healthy monthly subscriber growth rate for an active YouTube channel falls in the range of 2–3%. Growth above 5% per month is considered strong. Growth below 1% sustained over two or more consecutive quarters typically signals a content-strategy problem: either the topics aren’t reaching new viewers, the call-to-subscribe isn’t present, or the channel’s positioning isn’t distinctive enough to earn subscriber commitment. For B2B channels specifically, this benchmark is a floor check, not an ambition — the focus belongs on qualified viewer retention and CTA conversion, not raw sub count.
When Subscriber Count Misleads
B2B-specific data on subscriber benchmarks is genuinely thin in publicly available reports. Most published subscriber benchmarks aggregate across consumer entertainment, which is why we’re framing these as directional planning ranges rather than validated industry norms. What B2B marketing teams commonly report anecdotally: a channel that consistently publishes category-relevant content will tend to attract subscribers who are active buyers or researchers in that space. The subscriber-to-viewer ratio — how many of your total views come from subscribers versus non-subscribers — is often more informative. A B2B channel where 30–40% of views come from subscribers typically has a meaningfully engaged core audience, while a channel where 90% of views come from subscribers may have stopped attracting new-audience content.
The more productive framing for B2B teams: track subscribers as a lagging indicator of content quality and positioning. If your subscriber growth is flat despite consistent publishing and decent view counts, the channel’s value proposition likely isn’t clear enough for a viewer to commit to following. If subscribers are growing but views per video are flat, your notification-driven audience is loyal but you haven’t cracked discovery for new viewers.
Click-Through Rate (CTR) on B2B YouTube
YouTube CTR — the percentage of impressions that result in a click on your thumbnail and title — is one of the most misread metrics in B2B marketing. Low CTR does not necessarily mean your content is failing. For B2B channels, a “low” CTR that is average for the category often reflects exactly what you’d expect: a niche audience that only clicks when a video is directly relevant to a specific problem they’re actively researching. That behavioral profile produces lower click rates than entertainment content and higher viewer intent when they do click.
Why B2B CTR Skews Lower
According to Lenos Tube’s CTR benchmark analysis, referencing Retention Rabbit data, an effective YouTube CTR target sits in the 4–6% range for most channels. Critically, CTR benchmarks vary sharply by content category: gaming channels average approximately 8.5%, while educational and professional content averages closer to 4.5%. B2B technology and software content sits at the lower end of that educational range — typically somewhere between 3% and 5% for an established channel, depending on how broadly or narrowly the topic is framed. A very niche topic (e.g., “how to configure multi-cloud security policies in [specific platform]”) will naturally have a lower CTR than a broadly framed topic (e.g., “why your IT team is losing time to manual tasks”), because the narrow topic appears in fewer recommendation surfaces where it might be incidentally clicked.
What a “Good” CTR Looks Like for B2B
YouTube’s own guidance, documented in the YouTube Studio Help Center, notes that most channels and videos perform somewhere between 2% and 10% CTR, with the majority falling in the 2–5% range. They explicitly caution against comparing your CTR to a universal benchmark because impression sources differ significantly. A video that gets most of its impressions from Suggested Video feeds (high-intent browse) will have a different CTR profile than the same video getting impressions from the Home feed (lower intent, broader audience). For B2B teams, the key diagnostic: if your CTR is below 2% consistently, your thumbnails or titles may not be communicating enough value. If your CTR is above 6%, but watch time and retention are low, you may be overpromising in the title.
Note: these CTR ranges are directional, drawn from cross-referencing published platform guidance and third-party studies. Your actual CTR will vary by impression source, thumbnail design, topic, and channel history. Use them as orientation, not hard targets.
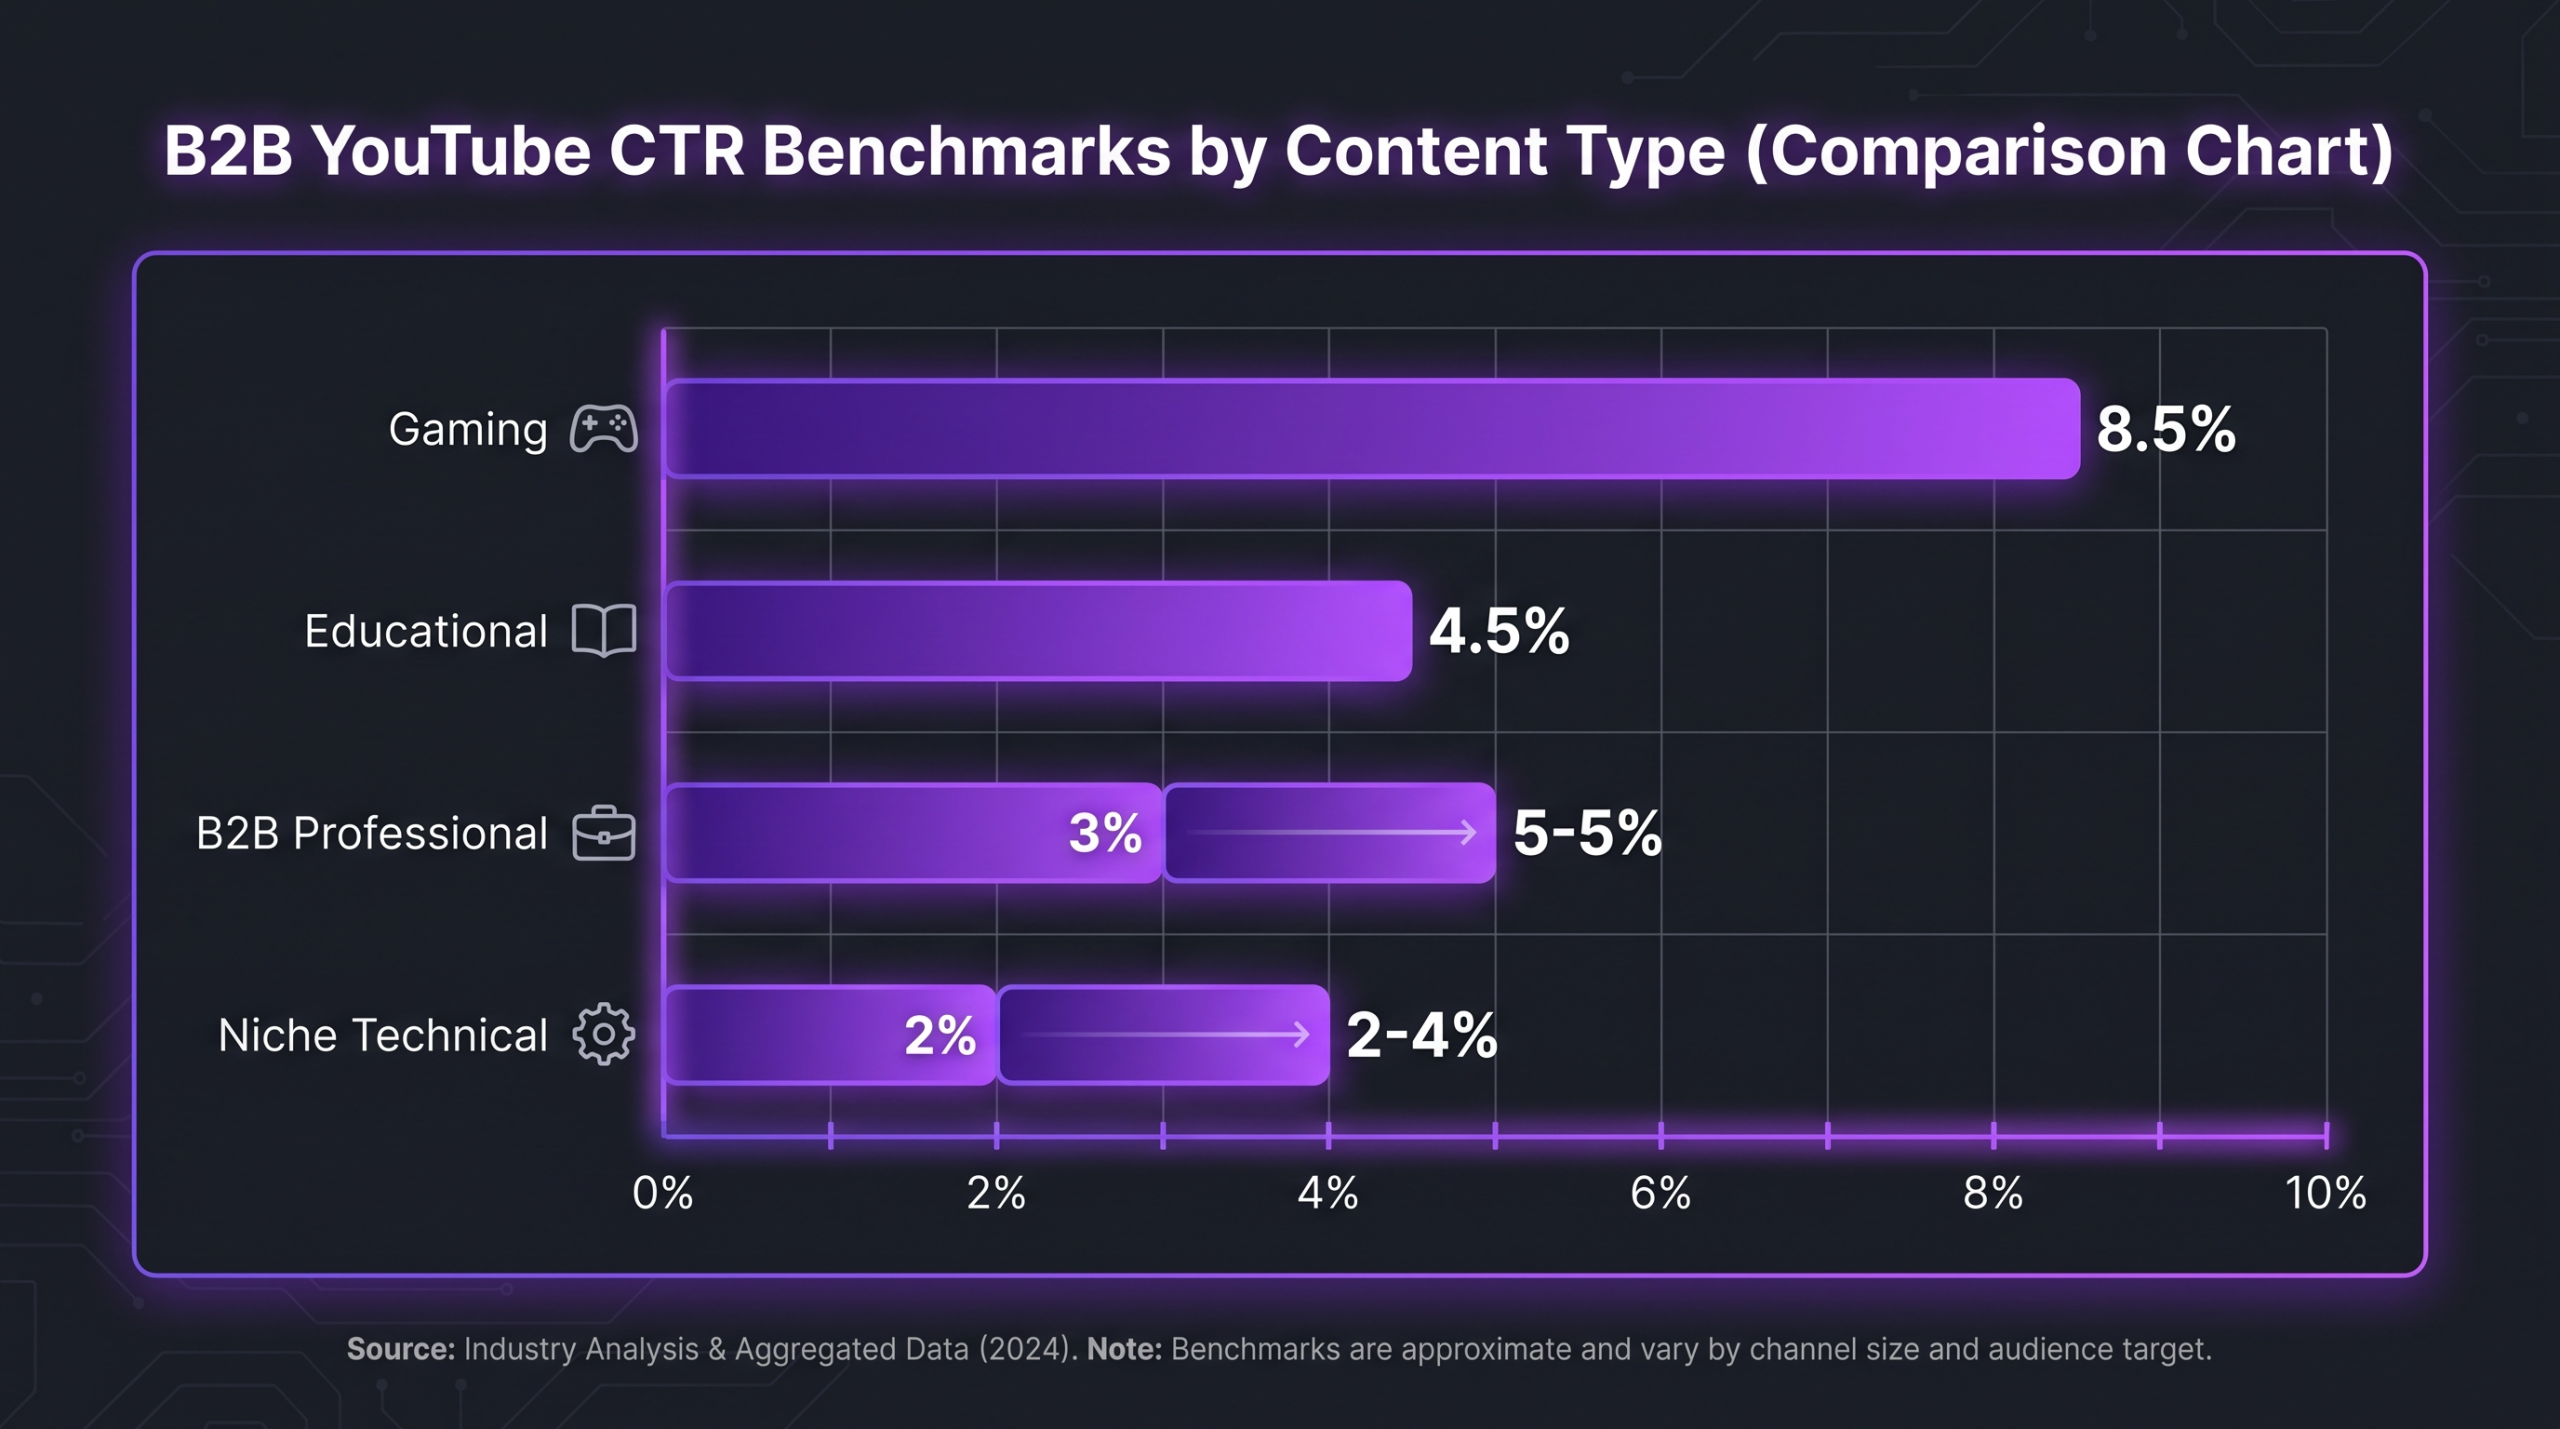
Directional CTR ranges by content category — B2B professional content consistently sits below entertainment averages, reflecting higher viewer intent rather than lower content quality.
Audience Retention: The Metric That Actually Moves Pipeline
Of all the B2B YouTube benchmarks, audience retention is the one most directly correlated to pipeline impact. A viewer who watches 70% of your 12-minute product deep-dive is a fundamentally different lead signal than a viewer who clicks, watches 45 seconds, and leaves. Retention benchmarks are also the area where B2B channels most commonly outperform their platform-average peers — because B2B viewers who click on a highly relevant video are genuinely trying to solve a problem, and they’ll stay if the content delivers.
Retention Benchmarks by Video Length
Retention benchmarks are strongly length-dependent. According to Humble&Brag’s audience retention benchmarks analysis, for videos in the 5 to 15-minute range — the most common format for business and educational content — a healthy average percentage viewed falls between 40% and 55%. This is the format length where pacing becomes the primary determinant of whether viewers stay or leave. Videos under 5 minutes typically see higher retention percentages (60%+) but generate less total watch time and fewer opportunities to communicate complex value propositions. Videos over 15 minutes see retention percentages decline, but absolute watch time can be higher if the content is strong.
A key insight from Virvid’s 2026 analysis of how YouTube’s algorithm weighs these signals: a 6-minute video with 80% retention — meaning 4.8 minutes of actual watching — consistently outperforms a 20-minute video with 30% retention (6 minutes watched) in terms of algorithmic distribution. The algorithm reads high retention as viewer satisfaction, regardless of absolute duration. This matters for B2B teams deciding between a tight 7-minute case study and an unedited 22-minute webinar recording: the edited, well-paced version almost always wins on both retention and downstream distribution.
Reading Your Retention Curve
YouTube Studio provides a per-video retention curve — a graph showing exactly what percentage of viewers remain at each second of your video. For B2B teams, the drop-off pattern tells you far more than the average retention percentage alone. A sharp drop in the first 30 seconds means your intro is failing to deliver on the promise of the title or thumbnail. A steady gradual decline across the whole video is normal and acceptable — that’s the natural shape of a retention curve for any video. A sudden cliff at a specific timestamp usually indicates a section that’s losing relevance: a long logo animation, a slow transition into a dense technical detail, or a digression that loses narrative momentum. Editing decisions — pacing, segment ordering, on-screen graphics that reinforce key points — are the direct levers that move retention. This is where a professional video editing agency with B2B experience earns its value: the retention curve is a diagnostic that should directly inform edit decisions on future videos.
💡 Pro Tip: Compare retention curves across your top 5 videos. The timestamps where viewers consistently stay longest are your content’s actual value peaks — often not where you thought they were. Restructure future videos to front-load those sections. A well-edited video that delivers its core insight in the first third typically retains 20–30% more viewers through the midpoint than one that builds slowly to a payoff.
Lead Signals: What the Standard Benchmarks Don’t Show You
Views, CTR, subscribers, and retention are all channel-health diagnostics. None of them are B2B pipeline metrics. The gap between “our YouTube channel is performing well by platform benchmarks” and “our YouTube channel is generating pipeline” is where most B2B video strategies get lost. The benchmarks in this guide help you answer one question: is the channel functioning normally? They don’t answer the question that actually matters to your revenue team: is it working?
Watch Time as a Pipeline Proxy
Total watch time — the aggregate minutes viewed across all your videos — is the single most useful indirect pipeline proxy on YouTube. High watch time on specific video categories (e.g., demo videos, pricing explainers, competitor comparison walkthroughs) indicates that viewers are in active evaluation mode. A company that’s watched 45 minutes of your content across three videos is in a fundamentally different funnel position than a company that bounced after 90 seconds. While YouTube doesn’t offer native intent scoring, overlaying YouTube watch time data with your CRM can reveal patterns: which video topics your closed customers had watched before converting, which content they’d watched during deal stages that went dark.
The complete guide to video editing for SaaS companies covers how to integrate video production planning with conversion tracking at the channel level, which is worth reading alongside this benchmarks guide. Knowing what good performance looks like and knowing how to tie it to revenue are two separate exercises that reinforce each other.
The Metrics to Build Weekly Reports Around
For a B2B marketing team reporting YouTube performance to leadership on a weekly basis, here is a practical hierarchy. Primary: total watch time, average view duration percentage, and the ratio of views from Search vs. Suggested. Secondary: CTR segmented by traffic source (Search CTR and Suggested CTR will differ, and that’s useful information). Tertiary: subscriber net adds. Vanity: total subscriber count as a standalone number. The primary metrics tell you whether your content is reaching the right audience and holding their attention. The secondary metrics tell you whether your positioning is landing. The tertiary metric tells you whether viewers found enough value to want more. And if you’re also tracking how much your video production is costing relative to what it generates, you have the components of a real content ROI discussion.
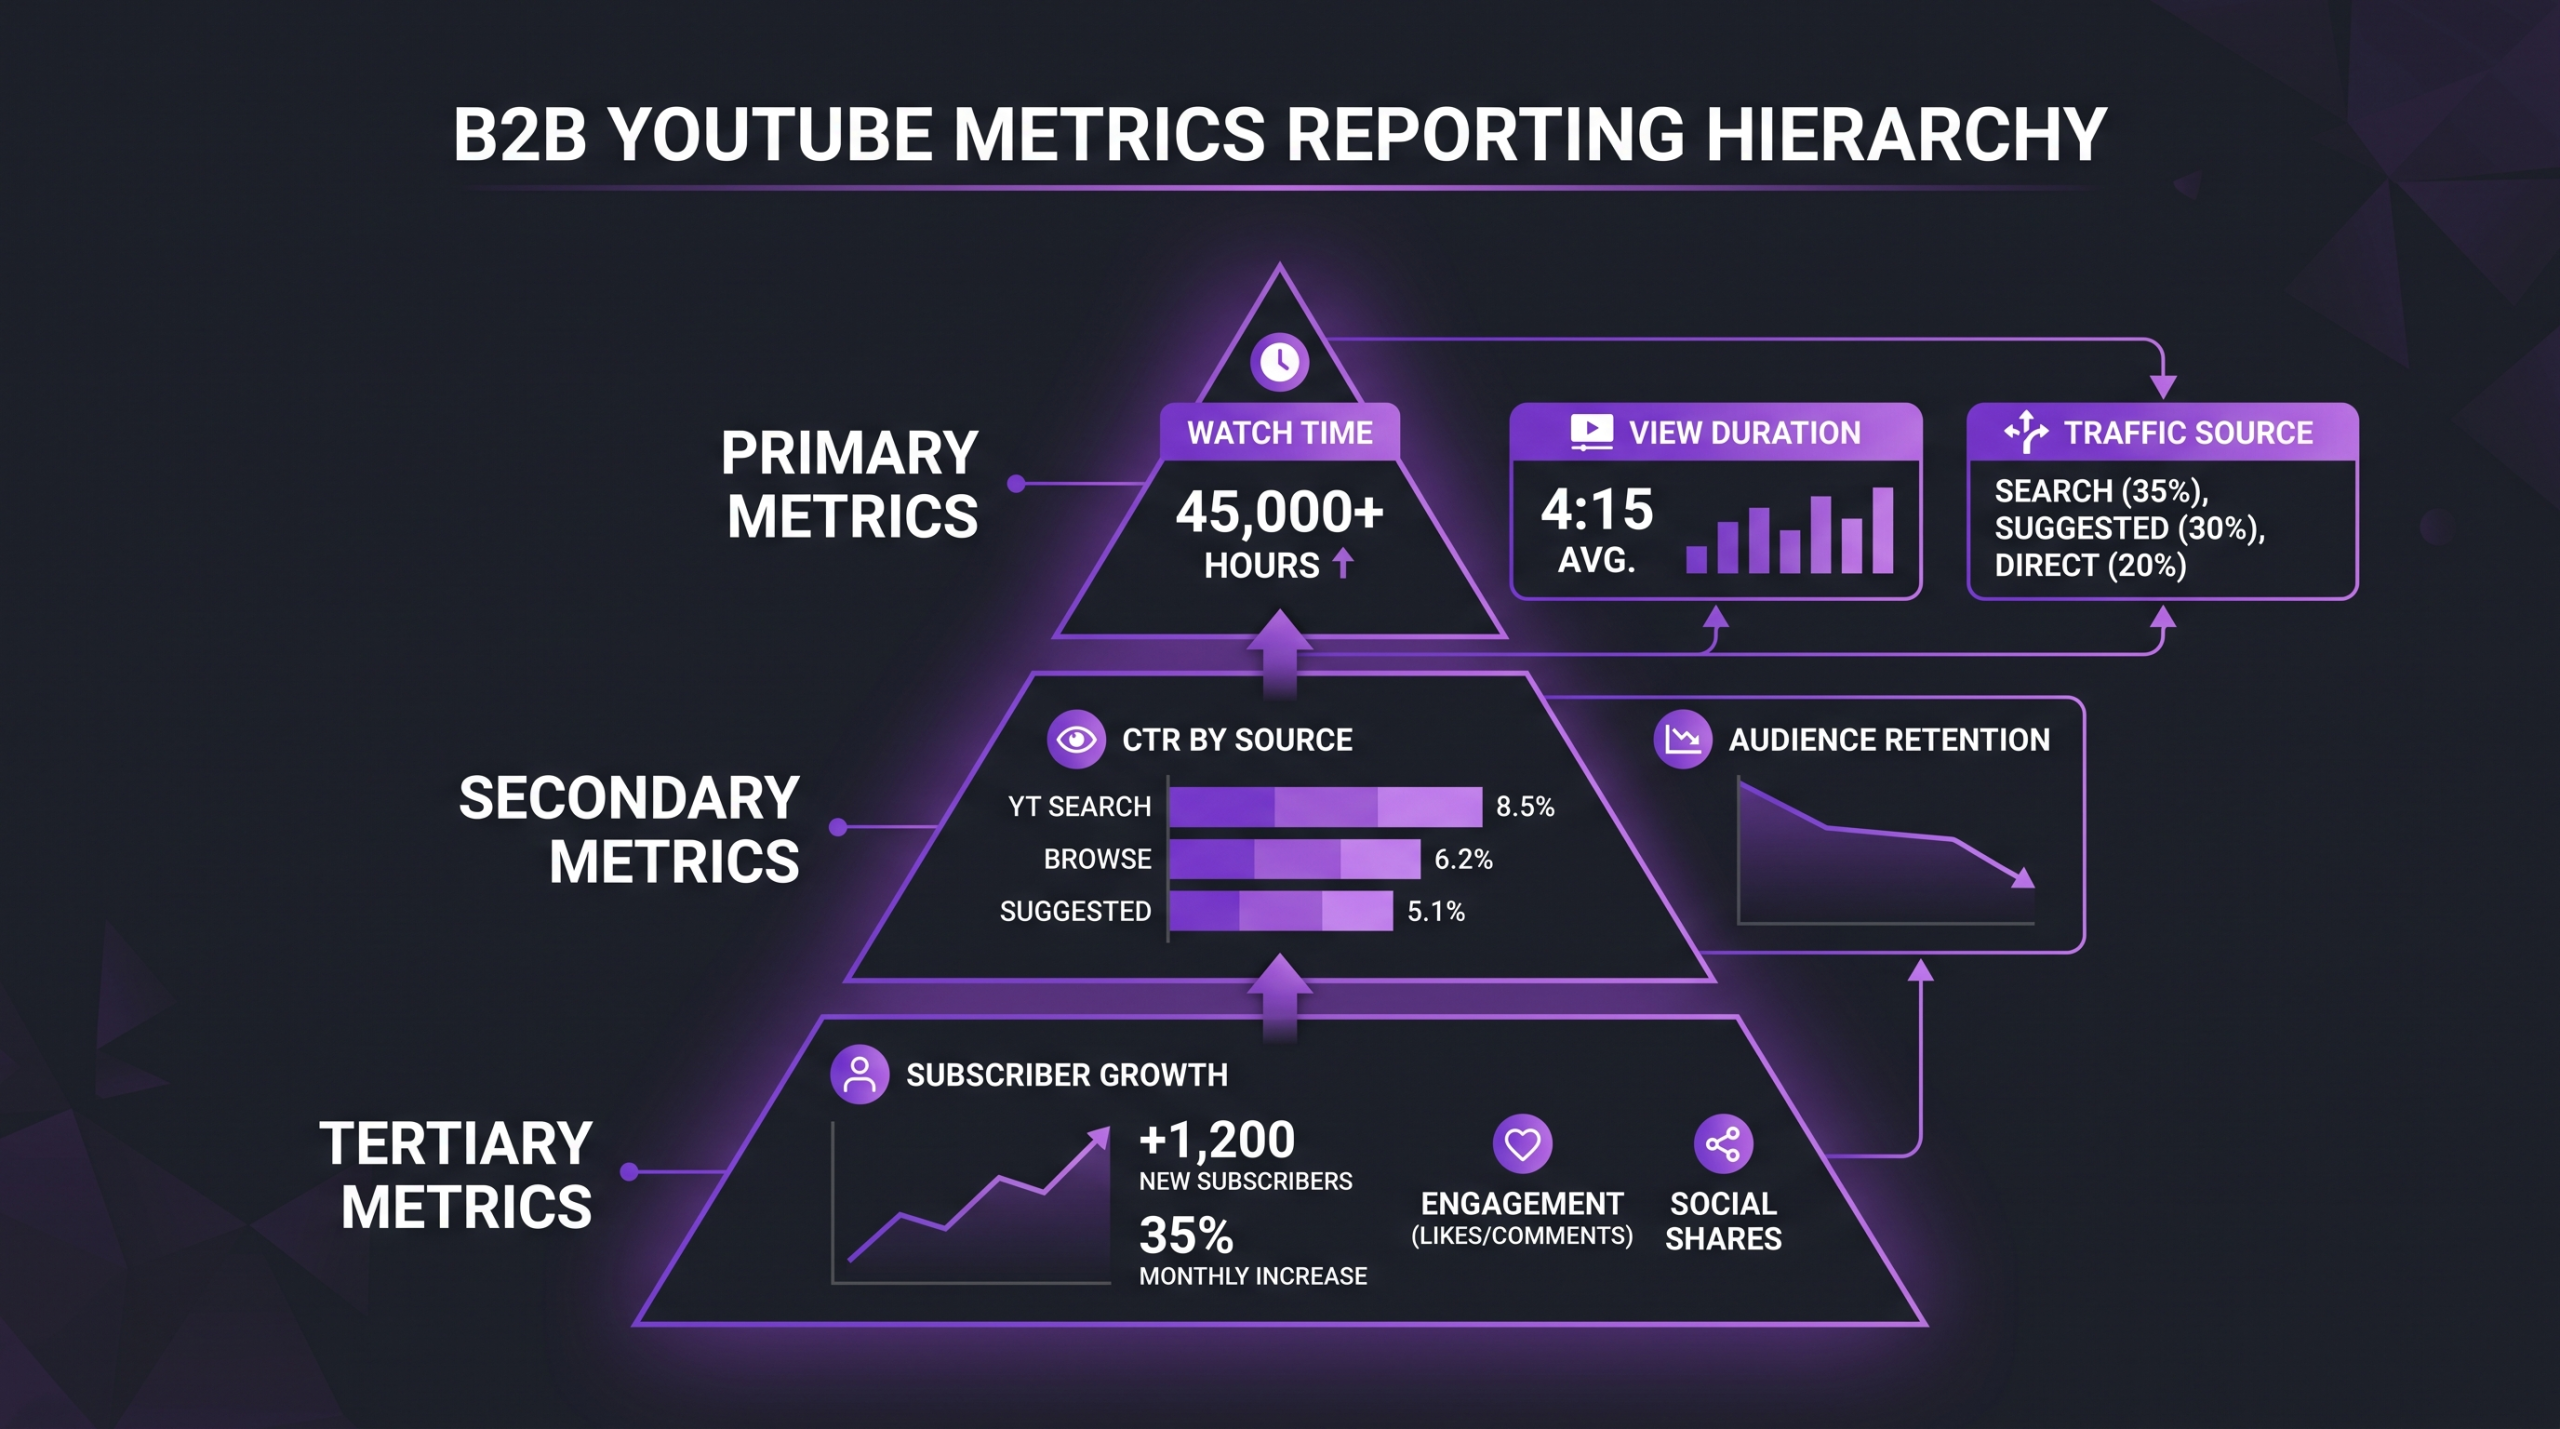
B2B YouTube metrics reporting hierarchy — most teams over-weight subscriber count and under-weight watch time and traffic source breakdown.
How to Use These Benchmarks as a B2B Marketing Team
Benchmarks are calibration tools, not goals. The right use of this data is not to tell your team “we need to hit 5% CTR by Q3.” The right use is to orient your team toward what’s normal so you can distinguish between a content problem, a distribution problem, a topic problem, and a production problem. Each diagnosis leads to a different fix. Treating all performance gaps as “we need better thumbnails” misses the underlying cause about 60–70% of the time.
Set Context-Appropriate Goals
Before setting any YouTube performance goals, document the context: your current subscriber count, your primary traffic source split (Search vs. Suggested vs. Browse), and the category of content you’re publishing most. Then benchmark against the relevant ranges from this guide, not the platform average. A new channel (under 1,000 subscribers) that sets 2,000 views per video as a benchmark is setting itself up to justify cutting the program after two months. The appropriate benchmark for that channel might be 80–120 views per video, and success is whether those views are coming from the right search queries, not whether the number looks good in a slide deck.
The Quarterly Benchmark Review
Industry benchmarks shift as platform behavior evolves. Run a quarterly review of your own channel’s averages against current published data — not to chase every shift, but to catch when your channel’s trajectory has meaningfully diverged from category norms. If your retention benchmarks have been holding at 45–50% for a year and suddenly drop to 25–30% over three consecutive months, that signals something has changed: either in your content quality, your topic selection, or in audience expectations within your category. Similarly, if your CTR has been running at 3.5% and an algorithm change pushes it to 1.8% without a corresponding drop in watch time, that’s a thumbnail and title problem worth fixing — not a channel-quality signal.
The teams that get the most from B2B YouTube treat it as a compounding research and production engine — not a broadcast channel. They study their retention curves religiously. They A/B test thumbnail styles. They track which video topics correlate to CRM activity. And they invest seriously in production quality, because for a B2B audience, a poorly edited video with stuttering cuts, dead air, and no on-screen graphics signals something about the company’s standards that extends beyond the video itself. A well-produced channel signals that the company takes its craft seriously. That’s brand work and demand generation at the same time.
Frequently Asked Questions
What is a good CTR for a B2B YouTube channel?
For B2B and professional content, a CTR in the 3–5% range is generally considered healthy, based on published platform guidance and third-party category benchmarks. Niche technical content may sit as low as 2–3% and still be performing normally given its small but highly relevant impression pool. If your CTR is consistently below 2%, focus on thumbnail clarity and title specificity before assuming the content itself is the problem.
How many views per video is normal for a new B2B channel?
For a B2B channel with under 5,000 subscribers, 100–400 views per video in the first 48 hours is a reasonable planning range based on published agency benchmarks. According to Humble&Brag, a B2B SaaS company generating 200 views per video is likely in the top 30% of new business channels in its category. The platform-wide average of 687 views is driven by Shorts and consumer content and should not be used as a B2B reference point.
What retention rate should a B2B YouTube video aim for?
For videos in the 5–15 minute range (the most common format for business and educational content), a retention rate of 40–55% average percentage viewed is considered healthy by published agency benchmarks. Videos under 5 minutes typically achieve higher retention percentages. What matters more than hitting a specific number: watching your own channel’s retention curves over time and identifying where you’re losing viewers and why, then using those findings to improve edit pacing in future videos.
How fast should a B2B YouTube channel grow in subscribers?
A monthly subscriber growth rate of 2–3% is considered healthy for an active channel, with above 5% indicating strong momentum and sustained below 1% signaling a content or positioning problem (per 2025 benchmarks from Ventress.app). For B2B channels specifically, treat subscriber growth as a channel-health indicator rather than a primary success metric. A small engaged subscriber base in your exact target market is worth more than a large disengaged one.
Should B2B companies care about the YouTube algorithm?
Yes, but differently than consumer brands do. B2B channels should optimize for YouTube Search first — because their audience is actively looking for solutions, not browsing for entertainment. Suggested Video algorithmic distribution matters more once a channel reaches the established or authority stage (roughly 5,000+ subscribers with strong watch time history). In the early stages, Search optimization — keyword-relevant titles, clear descriptions, and well-paced content that retains viewers — is the more reliable and compounding distribution strategy than chasing Suggested placement.
Verdict
B2B YouTube benchmarks exist — but you have to work harder to find the right ones than the platform-wide averages most reports quote. The headline numbers (687 average views per video, 2.34% engagement rate) are real data from real studies, but they’re measuring a wildly heterogeneous platform that has almost nothing to do with a software company’s product walkthrough library. The more useful frame: a B2B channel with 200 views per video, 45% retention on 8-minute videos, a 3.5% CTR, and consistent 2–3% monthly subscriber growth is a healthy channel. Measure yourself against your category, not the platform.
The benchmark that matters most is not any number from this guide — it’s the pattern you build from your own channel’s data over six to twelve months of consistent publishing. That channel-specific data, read alongside the directional benchmarks here, gives you an honest picture of what’s working, what needs fixing, and where production quality is either reinforcing or undermining your authority in your market. For B2B teams that want to build a channel that compounds in value rather than requiring constant firefighting, that means pairing strong topic strategy with production quality that reflects your brand’s standards — because in B2B, production signals competence before the viewer even hears your first sentence.
If you’re reviewing your video output and finding that the production quality isn’t matching the quality of your content strategy, it’s worth exploring what working with a dedicated video editing agency actually costs and what it returns — the answer may be different from what you expect. Start with our breakdown of professional video editing costs to understand the range of options available to B2B teams at different stages.
Ready for Video That Actually Converts?
Tell us about your project and we will put together a custom plan.