










![3D Explainer Video - ScribbleLive.mp4_snapshot_00.12_[2022.03.09_03.14.16]](https://increditors.com/wp-content/uploads/elementor/thumbs/3D-Explainer-Video-ScribbleLive.mp4_snapshot_00.12_2022.03.09_03.14.16-r7wb53mx72rxst3qcqyrfxdmeyzb5r9jbl0wbjujh4.png "3D Explainer Video – ScribbleLive.mp4_snapshot_00.12_[2022.03.09_03.14.16]")






























Video retention benchmarks differ dramatically by platform because each platform defines “view,” “completion,” and “engagement” differently. YouTube rewards sustained watch time; TikTok prizes completion and loop-back rate; LinkedIn’s algorithm favors early drop-off less harshly than you’d expect; B2B-hosting platforms like Wistia and Vidyard publish the most transparent benchmark data. This guide decodes what “good retention” actually means on each platform in 2026 — and what your editing team needs to do differently for each one.
- Why Retention Benchmarks Are Not Comparable Across Platforms
- How Each Platform Defines and Measures Retention
- YouTube Retention Benchmarks 2026
- LinkedIn Video Benchmarks 2026
- TikTok Retention Benchmarks 2026
- Instagram Reels Retention Benchmarks 2026
- B2B Hosted Video Benchmarks (Wistia & Vidyard)
- Cross-Platform Comparison: What “Good” Looks Like
- The Editing Variables That Move Retention Scores
- How to Build Your Own Platform-Specific Baseline
- FAQ
- Verdict
Why Retention Benchmarks Are Not Comparable Across Platforms
One of the most expensive mistakes a video marketing team can make is treating retention metrics from different platforms as equivalent. A 60% “completion rate” on TikTok and a 60% “average view duration” on YouTube measure very different viewer behaviors — and using the same editorial threshold for both will either make your reporting look deceptively good or push your team to optimize the wrong things.
Platform retention metrics diverge in three fundamental ways. First, the definition of a “view” varies: YouTube counts a view after roughly 30 seconds or the end of a short video, while Meta counts one after just 3 seconds and TikTok registers a view from the first frame. Second, the metric itself differs — YouTube reports audience retention as a percentage of the video watched; TikTok reports completion rate (percentage of viewers who watched to the end) plus loop count; LinkedIn reports view-through rate at specific duration thresholds. Third, the algorithm relationship to retention is different: on YouTube, sustained watch time across a session is a core ranking signal, while on TikTok, completion rate plus early shares and comments determine distribution velocity.
This guide is not a platform-specs reference. Its purpose is to give marketers a practical interpretation framework: what does “above benchmark” retention mean on each platform, how should you calibrate your editing briefs differently, and how do you build a single reporting dashboard that doesn’t compare apples to carburetors.
💡 Pro Tip: Before benchmarking against industry averages, establish your own historical baseline for each platform. Platform-level benchmarks are directional guides — your account’s baseline is the actual target that matters to your algorithm and audience.
How Each Platform Defines and Measures Retention
Understanding what each platform actually tracks is the prerequisite to interpreting any benchmark figure. The definitions below are drawn from each platform’s official analytics documentation and help centers.
YouTube’s Audience Retention Report
YouTube Studio’s Audience Retention report, documented by Google here, shows what percentage of viewers are still watching at every second of your video. The summary metric most teams track is Average View Duration (AVD) — total watch time divided by total views — and Average Percentage Viewed, which normalizes AVD against video length. YouTube also provides a “relative audience retention” comparison against similar videos on the platform, giving you a true peer benchmark rather than a raw number.
YouTube Shorts, launched as a dedicated format, has its own retention signal: loop count (how many times the clip replays) is factored into Shorts distribution alongside completion rate. This makes Shorts editorially different from long-form — a clip that gets viewers to replay counts as higher engagement than one watched once in full.
LinkedIn’s View-Through Rate
LinkedIn’s native video analytics, described in LinkedIn’s Marketing Solutions documentation, track views at multiple thresholds: Views (3+ seconds), 25%, 50%, 75%, and 100% completion. For organic posts, the most reported metric is simply “views,” which LinkedIn defines as 3+ seconds of video playing in-feed. For Sponsored Content, View-Through Rate (VTR) at the 25% and 50% thresholds is the standard paid-video benchmark. This makes LinkedIn retention reporting less granular than YouTube’s curve-based approach — you get thresholds, not a continuous drop-off chart.
TikTok’s Completion Rate and Loop Metrics
TikTok’s creative analytics, detailed in TikTok for Business’s performance metrics guide, report Completion Rate (what percentage of viewers watched the full video) and Video Views by quartile (25%, 50%, 75%, 100%). For organic content, TikTok’s creator analytics also show average watch time. Crucially, TikTok factors loop count into its engagement weighting — a 15-second video that gets replayed counts as higher engagement per impression than a 15-second video watched once. The algorithm interprets looping as a signal of content value.
Instagram Reels Completion Rate
Meta’s Instagram for Business resources describe Reels performance metrics as including plays, reach, likes, comments, shares, and saves — with watch time visible in creator analytics. Instagram does not expose a granular retention curve in the way YouTube does; the primary engagement signals are plays-to-reach ratio, full video views, and saves. The algorithm rewards content that drives shares and saves as much as completion, which is an important editorial distinction.
B2B Hosting Platforms (Wistia, Vidyard)
Unlike social platforms, B2B video hosting tools like Wistia and Vidyard were built specifically for detailed retention analytics. Wistia’s State of Video reports and Vidyard’s Video in Business Benchmark Report are the most data-transparent benchmark sources available to marketers. Both report engagement rate (percentage of the video watched, averaged across all plays) and publish aggregated benchmark data across their user bases — making them the most comparable, like-for-like retention datasets in the industry.
YouTube Retention Benchmarks 2026
YouTube is the only major platform that gives creators a direct peer benchmark — the “relative retention” line in Audience Retention reports compares your video’s drop-off curve against similar-length videos on the platform. This makes YouTube’s own analytics the most honest benchmark tool available, because the comparison is baked in rather than published as an industry average.
Long-Form Video Retention Patterns
According to YouTube’s Creator Academy and widely corroborated by creator analytics tooling (TubeBuddy, vidIQ), an average percentage viewed of 40–55% is broadly considered the competitive range for long-form videos in the 8–15 minute bracket. Top-performing educational and tutorial content often maintains 55–70%+ average percentage viewed — these are directional ranges from aggregated creator community reporting, not official YouTube figures. The key retention events to watch in your analytics are: the first 30-second cliff (where casual viewers drop), the midpoint, and the final 20% (where subscriptions are often prompted).
Video length has a well-documented inverse relationship with average percentage viewed: the longer the video, the lower the percentage tends to be, even if absolute watch time is higher. A 20-minute documentary-style piece may see 35% average percentage viewed while still being a strong performer in its category. Use YouTube’s relative retention comparison — not a static percentage target — as your real benchmark.
YouTube Shorts Retention Patterns
For Shorts (videos under 60 seconds), completion rate and replay rate are the primary distribution signals. Published creator community benchmarks and YouTube’s own Shorts Creator guidance suggest that clips achieving 70%+ completion rate trend more reliably on the Shorts feed. Clips under 30 seconds naturally see higher completion; the editorial challenge is making 45–60 second clips maintain the same urgency as a 15-second clip. Loop-back is harder to achieve on Shorts than on TikTok because Shorts autoprogresses to the next video unless a viewer actively swipes back — making an irresistible opening even more critical.
The internal link between Shorts performance and long-form channel growth is real but indirect: YouTube’s own product documentation notes that Shorts subscribers can convert to long-form viewers, but the conversion rate varies widely by channel niche and how consistently you maintain format continuity.
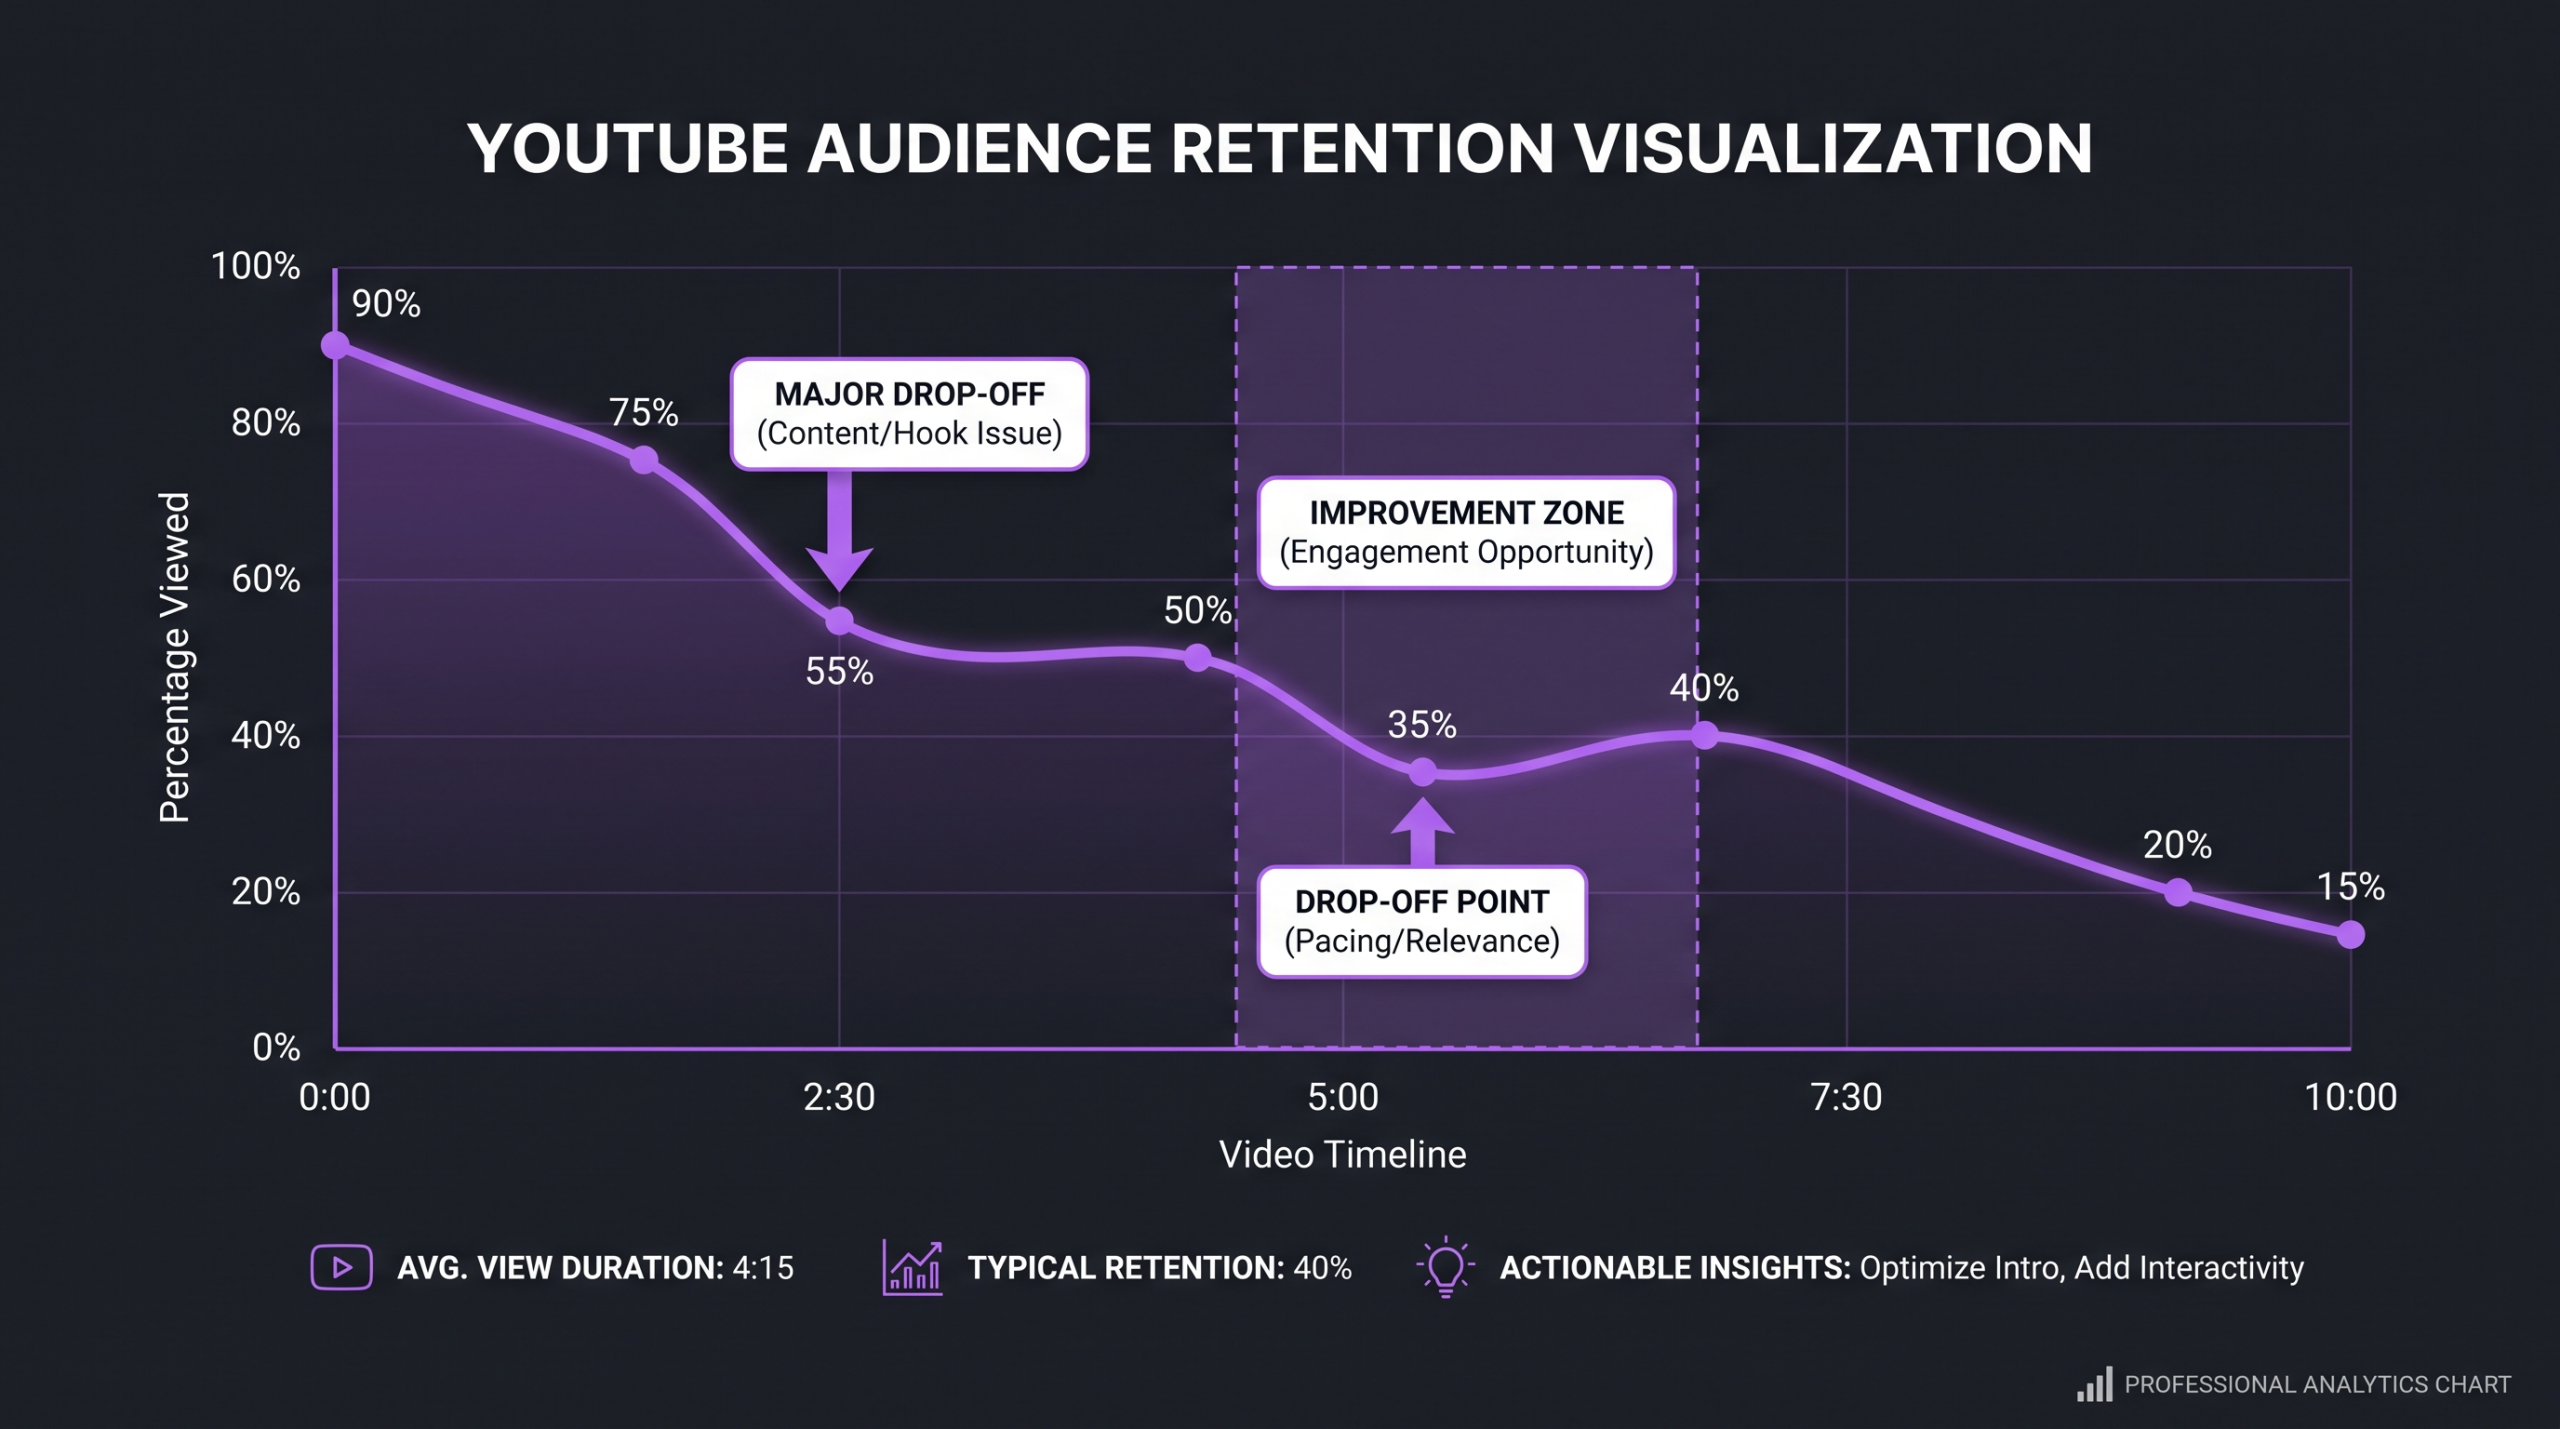
💡 Pro Tip: YouTube’s Audience Retention curve is more actionable than the average percentage viewed number. Look for “cliffs” at specific timestamps — these correlate with moments of unclear value, slow pacing, or missed pattern interrupts. Fix the edit, not the topic.
LinkedIn Video Benchmarks 2026
LinkedIn video is in a different editorial universe from YouTube and TikTok. The feed is professional and intent-driven; viewers are not passively scrolling for entertainment but scanning for career-relevant insight. This changes the retention dynamic significantly — a viewer who watches 30% of a 90-second thought-leadership clip and immediately DMs the author is a higher-value outcome than a viewer who watches 100% of a 15-second meme clip.
LinkedIn’s own published marketing research indicates that video posts generate up to 5x more engagement than non-video posts on the platform. For sponsored video, LinkedIn’s platform benchmarks (available through LinkedIn Campaign Manager) show that View-Through Rate at 25% completion generally falls in the 15–35% range for well-targeted B2B campaigns — though this varies sharply by audience targeting precision, creative format, and whether captions are enabled. These are directional ranges drawn from LinkedIn’s own benchmark publications and aggregated partner reports; your account’s historical baseline will be more predictive than the platform average.
The single most impactful editorial decision for LinkedIn retention is captioning. LinkedIn’s own data, referenced in multiple LinkedIn Marketing Solutions posts, suggests that captioned videos see significantly higher completion rates than uncaptioned ones — consistent with the fact that LinkedIn is almost exclusively a silent-autoplay environment. If your videos are not captioned, you are losing the majority of LinkedIn viewers in the first 3 seconds regardless of how good the hook is.
For organic LinkedIn video, the most reliable benchmark proxy is saves-to-views ratio. A post that gets shares and saves relative to impressions is being signaled by the algorithm as high-value — and saves correlate strongly with completion because you can only genuinely “save” something you understood.
TikTok Retention Benchmarks 2026
TikTok has the most transparent completion-rate reporting of any short-form social platform, but it also has the highest editorial bar for achieving above-average retention. The For You feed is brutally competitive — viewers swipe within the first 1–2 seconds if the opening frame does not compel them to stay. This makes TikTok the platform where production quality and editing rhythm have the most direct and measurable impact on distribution.
TikTok for Business’s own creative playbook and published creative insights data indicate that ads achieving completion rates above 50% consistently outperform lower-completion counterparts in ROAS and reach. For organic short-form content (under 30 seconds), high-performing creators routinely report completion rates of 60–85% on videos that achieve meaningful distribution — though averages across all content types tend to be significantly lower. TikTok’s algorithm is particularly sensitive to the ratio of completions to impressions in a video’s first distribution wave (the first few hundred views); a strong early signal unlocks broader reach.
Loop rate is TikTok’s unique retention signal. TikTok auto-loops short videos, and a viewer who lets the video replay without swiping is implicitly signaling quality. Published creator reports and TikTok’s own creative effectiveness research suggest that videos with strong visual hooks and satisfying “circular” edits (where the ending flows naturally back to the beginning) achieve meaningfully higher loop counts and corresponding distribution boosts.
Instagram Reels Retention Benchmarks 2026
Instagram Reels operates in the same short-form attention economy as TikTok but with different algorithmic weighting. Meta’s published Reels insights and platform guidance consistently emphasize that saves and shares carry disproportionate weight in Reels distribution — more so than on TikTok, where raw completion tends to dominate. This means that an Instagram Reel that gets a 40% completion rate but a high save-to-view ratio can outperform a 70% completion Reel with few saves.
Regarding completion benchmarks: Meta does not publish a single universal completion rate benchmark for Reels. Third-party social media management platforms that aggregate client data — including Sprout Social’s industry benchmarks and Later’s annual Reels report — indicate that branded Reels under 30 seconds typically see 25–50% completion rates across accounts, with significant variation by vertical, following size, and content type. These are directional, not official Meta figures. The key editorial observation is that Reels under 15 seconds consistently outperform longer clips on completion — but Reels in the 30–60 second range can drive higher save rates when they deliver genuine instructional value.
For B2B brands on Instagram, Reels perform best when they deliver a clear, single insight or demonstrate a process visually. Abstract thought-leadership content — common on LinkedIn — tends to see lower completion on Reels because the format primes viewers for visual specificity, not verbal argumentation.
B2B Hosted Video Benchmarks (Wistia & Vidyard) 2026
B2B video hosting platforms are the best source of like-for-like retention benchmarks available to marketers because they report on an identical metric — engagement rate, defined as the percentage of the video watched averaged across all plays — across a consistent universe of business videos. Unlike social platforms, there is no algorithmic selection bias distorting the sample: these benchmarks reflect videos that were sent to prospects, embedded on landing pages, and included in email campaigns.
Wistia’s State of Video 2024 report, one of the most cited benchmark sources in B2B video marketing, documents that shorter videos deliver significantly higher engagement rates. Per Wistia’s published data: videos under 1 minute average around 50% engagement rate across their platform; videos in the 1–3 minute range average in the mid-40s; videos in the 3–7 minute range dip toward the high 30s. These are averages across all content types on Wistia — branded explainers, sales videos, product demos, and webinar clips. Your engagement rate will vary based on where the video is embedded and how it is promoted.
Vidyard’s Video in Business Benchmark Report (2024 edition) reports a median completion rate of approximately 52% across all business videos on their platform. Critically, Vidyard segments this by video type: sales prospecting videos (typically under 2 minutes, personal and direct-camera) tend to outperform longer explainer videos; customer testimonials in the 2–3 minute range consistently achieve above-median engagement. The report is available at vidyard.com/resources and is updated annually — the 2025 edition is a key document to reference when updating your benchmarks mid-year.
One unique signal available on B2B hosting platforms is rewatch behavior — individual viewers who watch a specific section multiple times. This is a strong intent signal (often indicating a purchase decision or technical evaluation) that social platforms do not expose. If you are using video in a sales funnel, track rewatch behavior by section as carefully as overall completion rate.
Cross-Platform Comparison: What “Good” Retention Looks Like in 2026
The table below synthesizes the directional benchmarks across platforms. These figures are drawn from the sources cited throughout this article and are presented as ranges, not precise platform-official figures. Use them as a calibration tool, not as pass/fail thresholds — your account’s own historical baseline is the most relevant reference point.
Sources: YouTube Creator Academy, LinkedIn Marketing Solutions documentation, TikTok for Business creative insights, Meta for Business Reels resources, Wistia State of Video 2024, Vidyard Video in Business Benchmark Report 2024. All ranges are directional — individual account performance varies based on audience, content type, and distribution context.
The Editing Variables That Move Retention Scores
Retention benchmarks only matter if you know what to edit to move them. The editorial variables below represent the levers with the most consistent impact on retention across platforms — not based on theoretical best practices, but on the patterns that a professional video editing agency like Increditors observes when auditing retention curves against editorial decisions across different content types.
The First-5-Seconds Hook
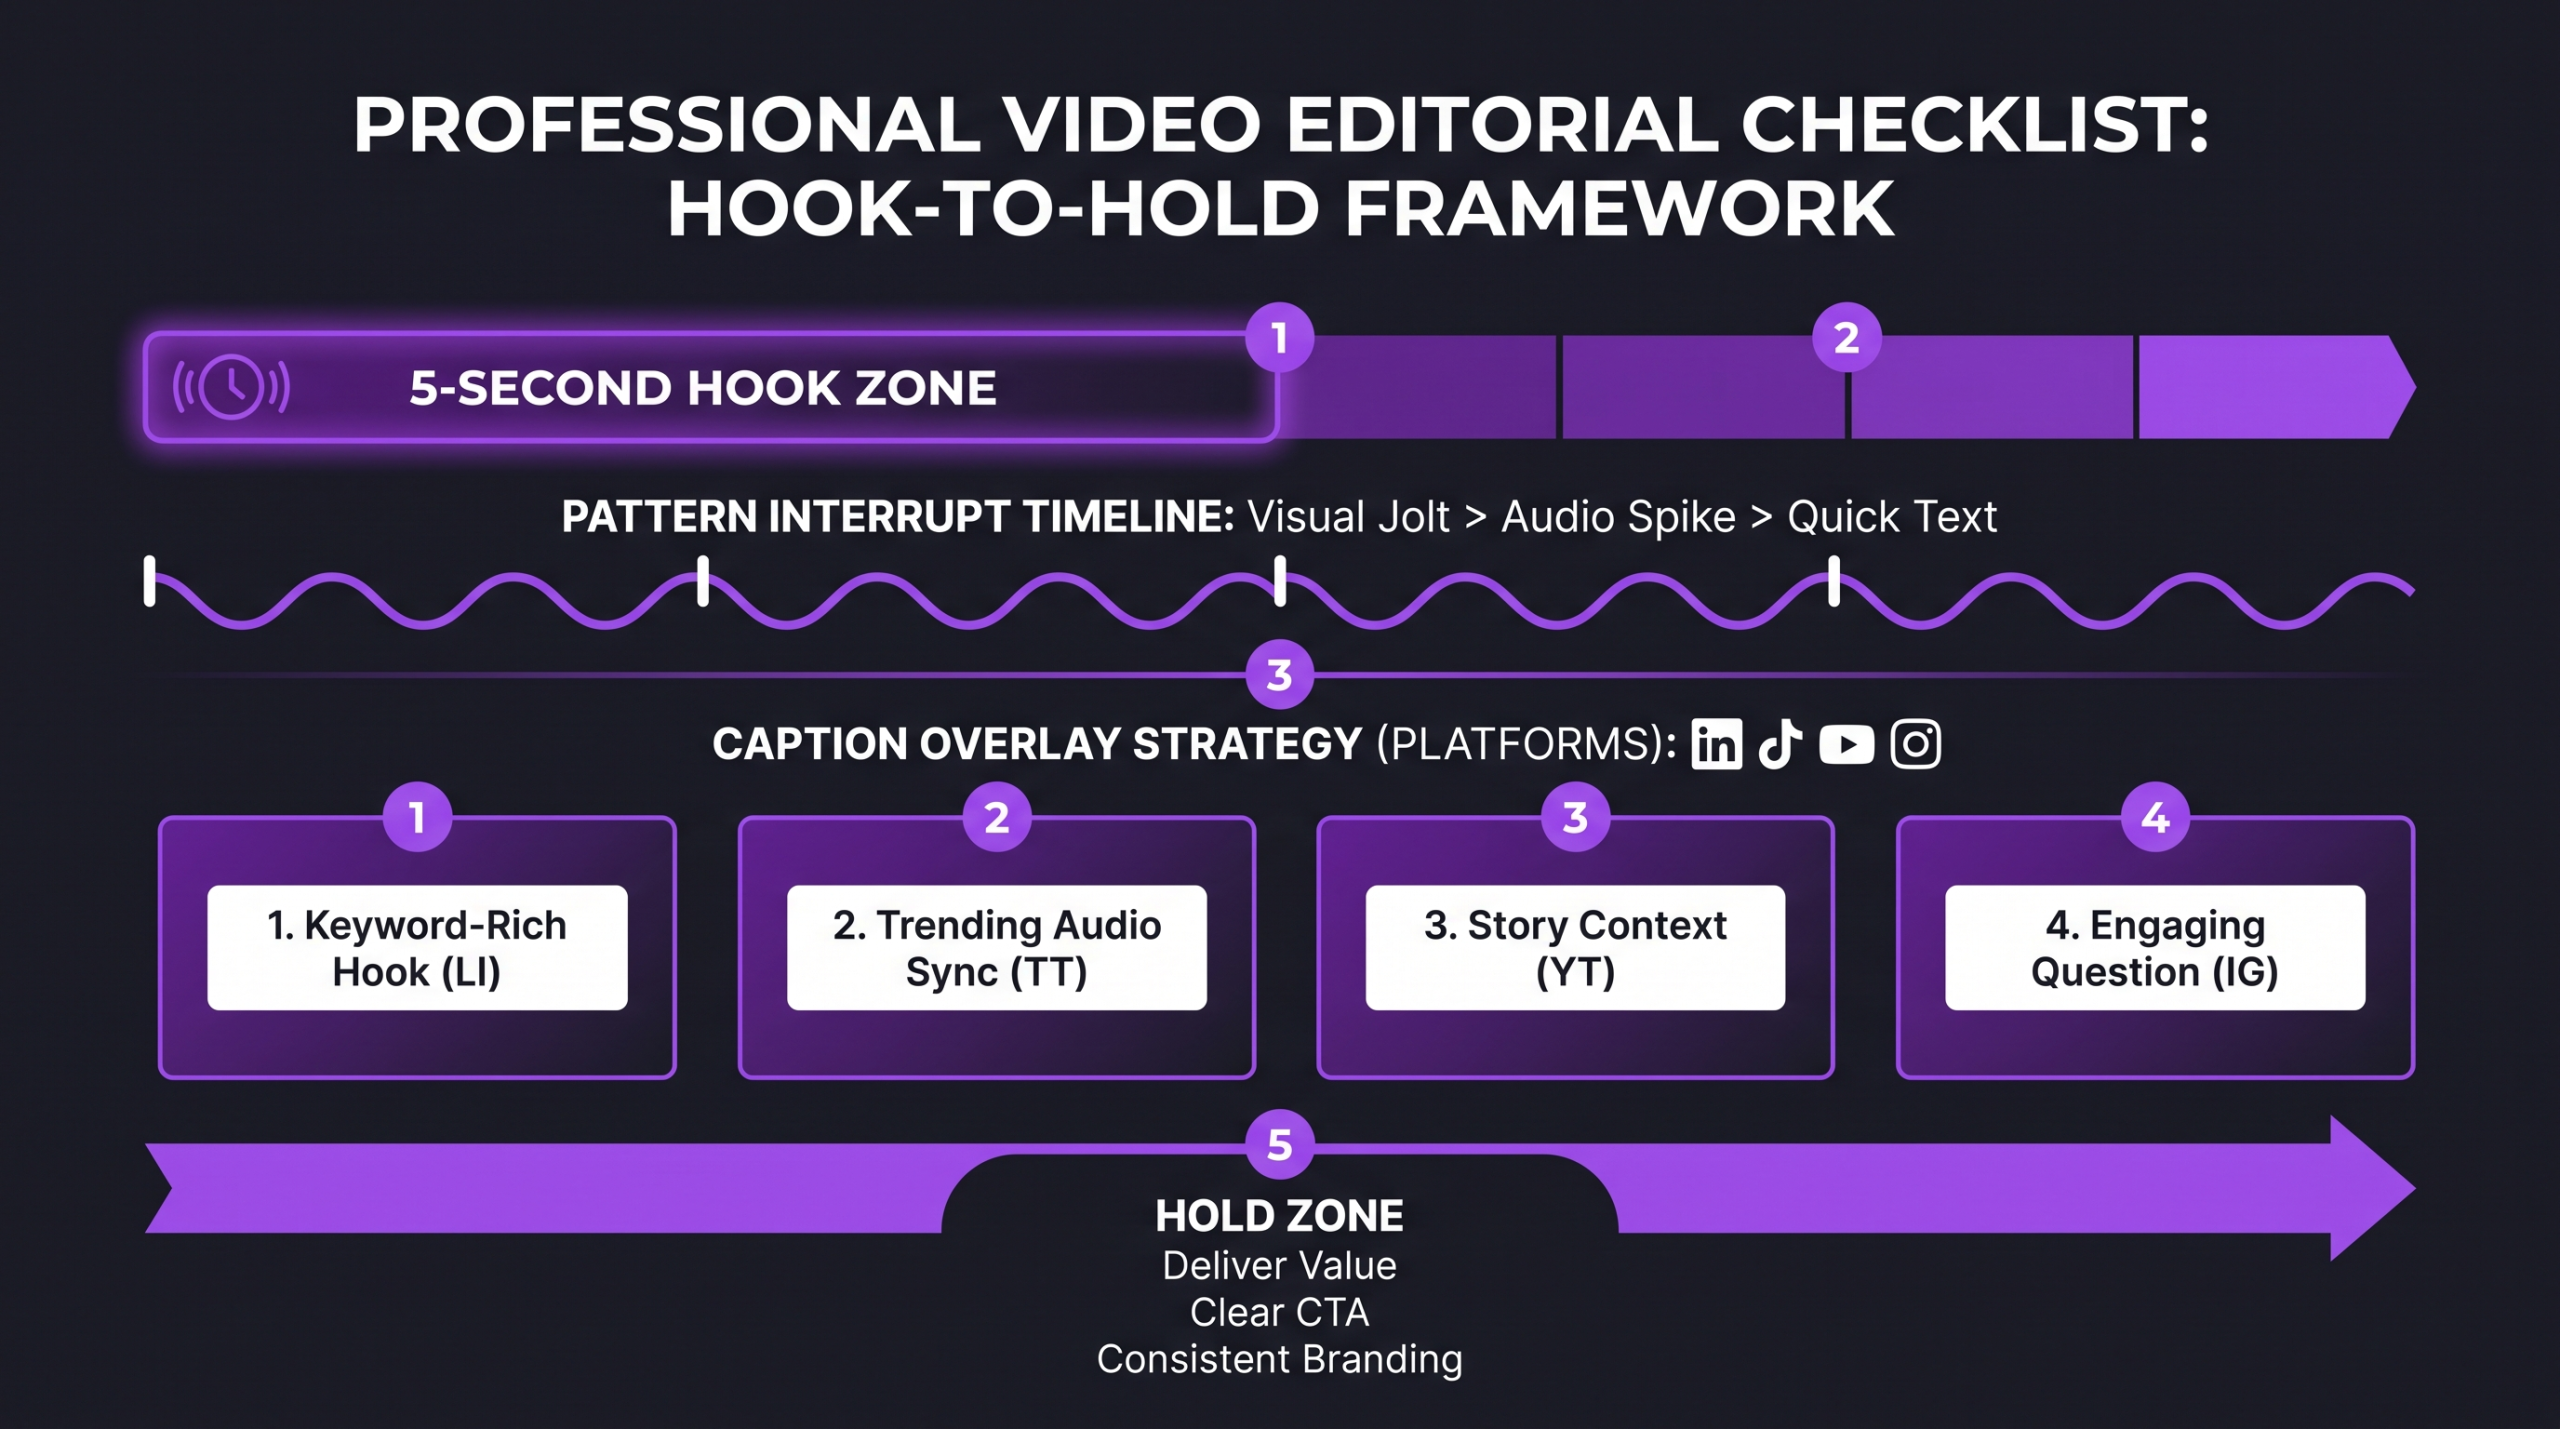
Across every platform, the first 5 seconds of a video are the single highest-leverage editing opportunity. This is where the retention cliff is steepest — viewer drop-off during the opening is the most common explanation for below-benchmark average view duration on YouTube and below-benchmark completion rates on TikTok and Reels. The editorial principle is the same regardless of platform: resolve the viewer’s implicit question (“why should I keep watching?”) within the first 5 seconds. On YouTube, this is often done with a strong verbal promise or a provocative setup cut. On TikTok and Reels, it is almost always done visually — with movement, on-screen text, or a pattern interrupt in the first 2 frames.
Pacing and Pattern Interrupts
Pacing is the most misunderstood retention variable. Many teams interpret “fast editing” as high-retention editing — but the relationship is more nuanced. Retention drops when viewers experience an unexpected slowdown relative to the pace the opening established. If your intro is fast-cut and energetic and your explanation section is a single locked-off talking head, you will see a drop at that transition. Pattern interrupts — b-roll cutaways, on-screen graphics, title cards, and audio design changes — reset viewer attention every 20–40 seconds and are one of the most reliable retention tools in a professional editor’s toolkit. This is one of the key reasons working with a specialized post-production team produces measurably different retention curves than working with a generalist or in-house editor who is managing pacing by feel rather than by analytics feedback loops.
Captions and Text Overlays
As noted in the LinkedIn section, captions are not optional on silent-autoplay platforms. But text overlays serve a different purpose than accessibility captions: they create a second information track that keeps visual learners engaged independent of audio. The editing decision of whether to use full-word captions, keyword highlights only, or animated text overlays should be driven by platform context and viewer profile. On LinkedIn and TikTok, full verbatim captions consistently outperform no captions. On YouTube, keyword-highlight overlays during key moments show better retention at those timestamps than captions alone, because they reinforce the information hierarchy visually.
Thumbnail-to-Content Alignment
On YouTube specifically, one of the most common causes of above-average click-through rate combined with below-average retention is a thumbnail-content mismatch. When a thumbnail or title promises something the video does not deliver in its first 60 seconds, viewers who were attracted by the promise leave immediately. This “bait” pattern may inflate impressions data while destroying watch time — and YouTube’s algorithm penalizes it. Thumbnail strategy is not separate from the editing brief; it is part of it. The editorial team and the creative team need to be aligned on what promise the video is making before either thumbnail or cut is finalized.
How to Build Your Own Platform-Specific Retention Baseline
Industry benchmarks are the starting point, not the destination. A brand in B2B fintech with a 50,000-subscriber YouTube channel operates in a completely different retention context than a consumer lifestyle brand launching its first Reels strategy. The most actionable retention benchmark you can have is your own historical average — segmented by platform, content type, and video length.
If your team is producing video across multiple platforms, consider maintaining a single retention tracker spreadsheet with platform-specific columns rather than relying on each platform’s native dashboard — the cross-platform view surfaces patterns (such as a format that retains well on LinkedIn but drops off on YouTube) that platform-siloed reporting misses. Understanding how much professional video editing costs becomes much clearer when you can quantify the retention improvement that professional post-production delivers relative to in-house production. For a deeper look at how top YouTube channels structure their editing pipeline, our 2026 review of the best video editing services for YouTube creators covers the options in depth.
FAQ: Video Retention Benchmarks by Platform
What is a good average view duration on YouTube in 2026?
A broadly competitive average percentage viewed for YouTube long-form content is in the 40–55% range, with top-performing videos in most niches reaching 55–70%+. However, the most meaningful benchmark is YouTube Studio’s relative retention comparison, which shows how your video performs against similar-length content — because a 45% average percentage viewed on a 20-minute video is very different from 45% on a 4-minute video.
Is TikTok completion rate or YouTube average view duration a better indicator of content quality?
They measure different things and are not directly comparable. TikTok completion rate reflects how well a short clip sustains attention against a low-friction swipe; YouTube average view duration reflects whether a viewer chooses to invest sustained time in your content. Neither is universally “better” — they each measure the editorial quality that is appropriate to their platform context.
Why does LinkedIn video get low completion rates even when the content is high-quality?
LinkedIn’s feed is a professional-intent environment where viewers rarely watch video the way they would on YouTube or TikTok. A viewer who watches 30% of a LinkedIn video and then takes a desired action (follows the account, DMs the author, clicks a link) is a higher-value outcome than someone who watches 100% passively. Optimize LinkedIn video for saves, follows, and comment engagement rather than raw completion.
How does video length affect retention benchmarks across platforms?
On every platform, shorter videos achieve higher completion rates — this is a universal pattern documented across Wistia’s benchmark reports, YouTube’s Creator Academy guidance, and TikTok’s creative insights. The editorial question is not “should I make shorter videos?” but “what is the minimum length needed to deliver the value I promised?” Cutting to that length — no more, no less — is the core retention discipline.
Where can I find official platform retention benchmarks to compare against?
The most reliable sources are: YouTube Creator Academy and YouTube Studio’s relative retention report; LinkedIn Marketing Solutions campaign benchmark documentation; TikTok for Business’s creative insights and benchmark reports; Wistia’s annual State of Video report (wistia.com/learn/marketing/state-of-video); and Vidyard’s Video in Business Benchmark Report (vidyard.com/resources). Most social platforms do not publish universal completion rate averages — third-party aggregators like Sprout Social and Later compile account-level data, but these are not official platform figures.
Verdict: Use Benchmarks to Set Direction, Not Destination
Cross-platform video retention benchmarks are more useful as interpretation frameworks than as hard performance targets. The core takeaway: each platform has a fundamentally different definition of “retention,” a different algorithmic relationship to it, and a different editorial lever that moves it. Treating them as equivalent — using a single “good = 60% completion” threshold across YouTube, TikTok, LinkedIn, and B2B hosting — will lead to bad editorial decisions.
The most actionable strategy is to build platform-specific baselines from your own historical data, use published benchmarks to calibrate whether you are in the competitive range, and map your editing decisions to your retention curves to understand which editorial choices are actually moving the metrics. For teams that want to close the gap between their current retention performance and benchmark ranges faster, working with a specialist post-production team that tracks retention feedback loops across a portfolio of clients provides a significant editorial acceleration that internal teams building these systems from scratch typically cannot replicate.
The platforms will continue to evolve their retention definitions and algorithmic weights — YouTube’s Shorts and long-form signals are already being rebalanced, TikTok’s loop weighting has shifted multiple times, and LinkedIn’s video push in 2025–2026 has changed the organic video retention dynamics significantly. Treat this guide as a 2026 snapshot and plan to revisit your benchmarks quarterly.
Ready for Video That Actually Converts?
Tell us about your project and we will put together a custom plan.