









![3D Explainer Video - ScribbleLive.mp4_snapshot_00.12_[2022.03.09_03.14.16]](https://increditors.com/wp-content/uploads/elementor/thumbs/3D-Explainer-Video-ScribbleLive.mp4_snapshot_00.12_2022.03.09_03.14.16-r7wb53mx72rxst3qcqyrfxdmeyzb5r9jbl0wbjujh4.png "3D Explainer Video – ScribbleLive.mp4_snapshot_00.12_[2022.03.09_03.14.16]")




























Hook rate (the share of impressions that become a 3-second view) and hold rate (the share of viewers who continue watching past the hook) are the two metrics that determine whether your video ad budget is being spent or wasted. Platform benchmarks suggest hook rates of 25–40% on Meta, 30–50% on TikTok, 15–30% on YouTube pre-roll, 30–45% on Instagram Reels, and 15–25% on LinkedIn. Hold rates drop steeply after the first 6 seconds on every platform. This guide breaks down the benchmarks, shows you how to diagnose which metric is your bottleneck, and gives concrete production tactics to improve both.
What Is Hook Rate in Video Ads?
Hook rate is the percentage of ad impressions that result in a viewer watching at least 3 seconds of your video. It is, in essence, the metric that answers one brutal question: did your first moments earn an audience, or did the scroll win?
The formula is straightforward: Hook Rate = (3-Second Video Views ÷ Impressions) × 100. On Meta Ads Manager, this appears as the “3-Second Video Plays” metric divided by “Impressions.” On TikTok Ads, it is surfaced as “6-Second Views” as well as shorter-window data. YouTube refers to related signals through its “Video Played to 25%” and view-duration reports in Analytics.
The 3-second window matters because it is the practical threshold at which a viewer has consciously chosen to stay — or the algorithm has registered enough intent to count an engaged impression. Below that threshold, your ad registered as noise. Above it, you have a real viewer whose attention you now need to hold.
Why Hook Rate Is a Leading Indicator
Hook rate is a leading indicator for every downstream ad metric: click-through rate, conversion rate, and return on ad spend. If hook rate is low, you are paying for impressions that generate no downstream behavior at all. The CPM has been spent; the audience has not engaged. Every unit of improvement in hook rate directly compounds with your subsequent funnel metrics because you are beginning with a larger pool of genuinely attentive viewers.
Published platform data from Meta Business Help confirms that 3-second video view rate is one of their primary recommended diagnostics for video ad creative quality — the signal they use to determine whether the creative deserves expanded delivery or a reduced bid multiplier in auction.
Hook Rate vs. Reach and Frequency
A common error is to confuse a high-reach campaign with a high-hook-rate campaign. You can reach 2 million people and have a hook rate of 8% — meaning 1.84 million of those impressions generated zero measurable engagement. Reach tells you how many eyes your ad appeared in front of. Hook rate tells you how many of those eyes bothered to look back.
What Is Hold Rate in Video Ads?
Hold rate measures what happens after the hook. It is the percentage of viewers who continue watching past the initial 3-second window — and then past subsequent milestones like the 25%, 50%, 75%, and 100% completion marks. Hold rate is not a single number; it is a curve, and the shape of that curve tells a more detailed story than any single point on it.
Most platforms express hold rate through their “video plays” at incremental thresholds. On Meta Ads Manager, you will find “Video Plays at 25%”, “Video Plays at 50%”, “Video Plays at 75%”, and “Video Plays at 100%” (ThruPlays). TikTok provides similar breakdowns in its Ads reporting interface. YouTube surfaces this through the Audience Retention graph in YouTube Analytics.
The Drop-Off Curve Every Advertiser Should Know
Industry benchmarks and published platform research consistently point to the same pattern: the sharpest drop in viewership happens between the 3-second mark and the 6-second mark. A viewer who has passed the hook is still evaluating whether the content is worth their time. If the video has not delivered a second reason to stay by the 6-second mark — a new visual stimulus, a specific promise, an open question — the scroll resumes.
According to data cited in Think with Google’s video strategy research, the first 5 seconds of a video ad are the highest-stakes creative window across all formats — applicable whether the viewer has a skip option or not, because behavioral data shows scroll-away rates spike at the same point as skip rates.
Hold Rate vs. View-Through Rate: Key Distinction
View-through rate (VTR) typically measures the percentage of impressions that result in a full video view (often defined as 15 or 30 seconds, platform-dependent). Hold rate is more granular: it tracks viewer retention at each milestone as a proportion of those who passed the hook. A video with a high VTR might have a low hold rate if it reached a small but highly committed audience. Tracking hold rate separately from VTR reveals whether your creative structure is doing its job throughout.
Hook Rate Benchmarks by Platform (2026)
These benchmarks are derived from published platform documentation, industry reports, and aggregated creative agency data. They represent ranges rather than single figures because hook rates vary significantly by industry vertical, audience size, creative format, and bidding strategy. Treat these as orientation — not as absolute targets for every account.
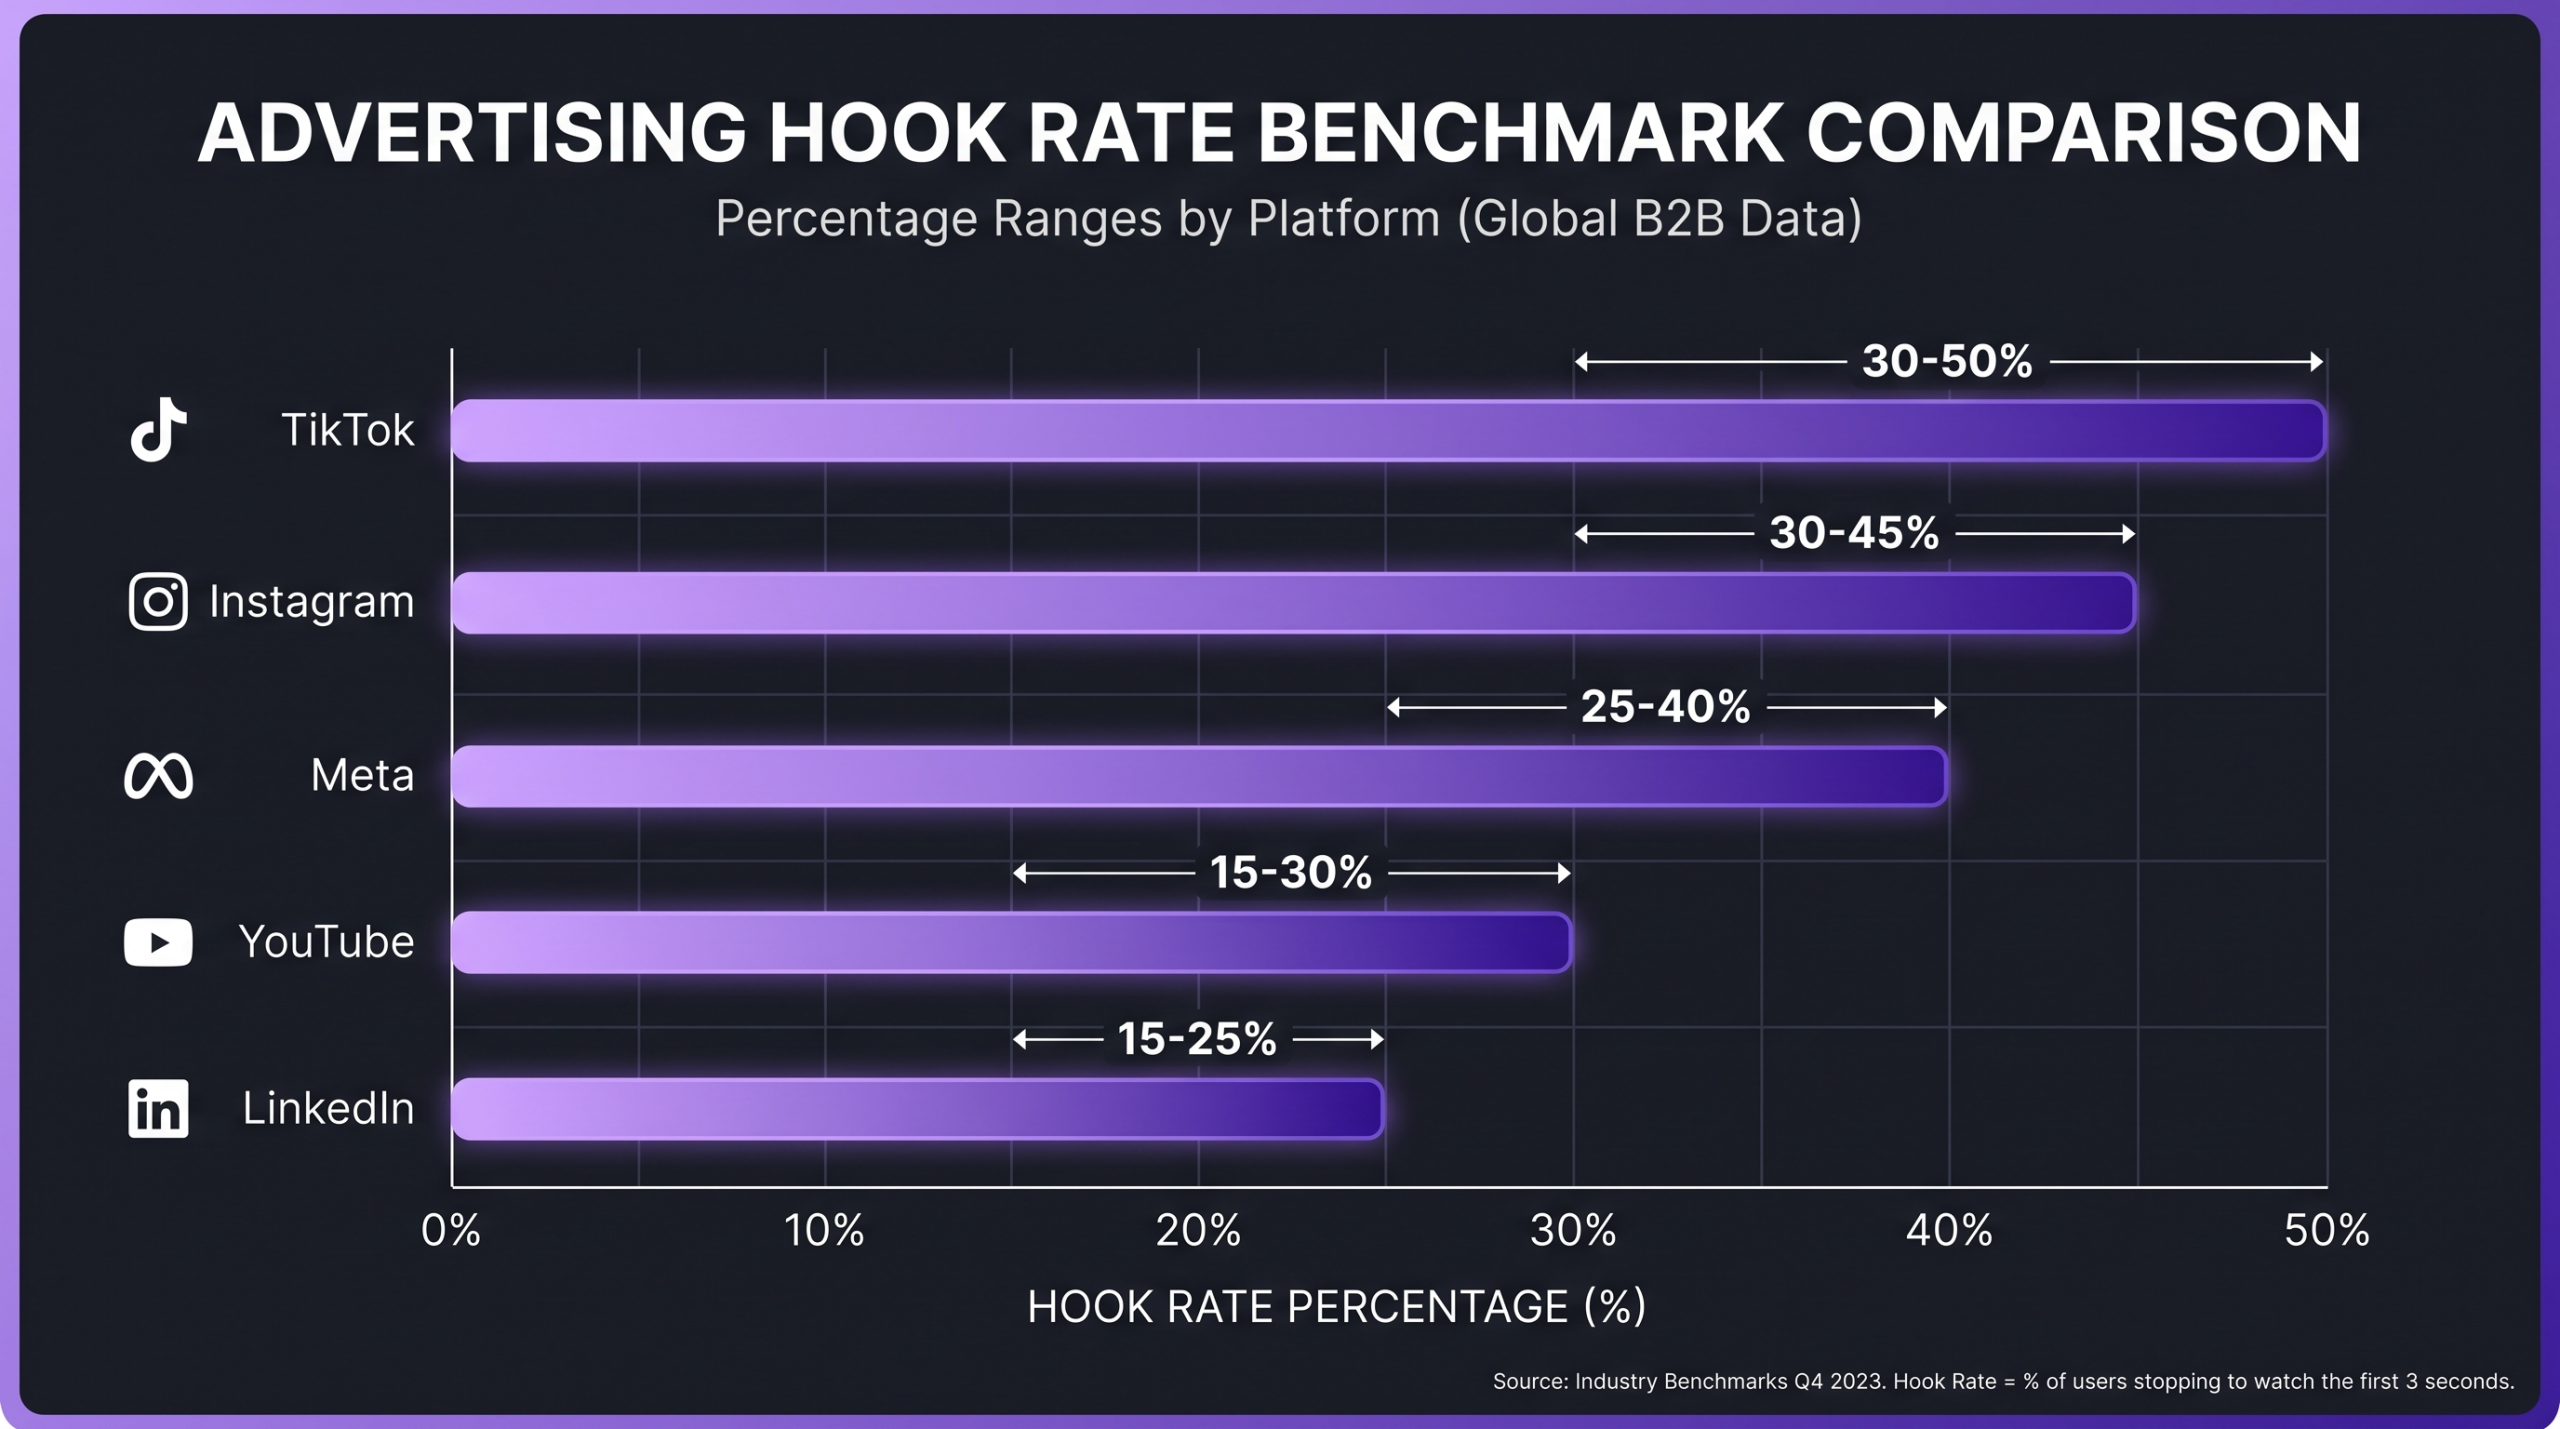
💡 Pro Tip: TikTok’s higher hook rate ceiling is partly structural — the algorithm pre-qualifies viewers by interest before serving the ad, reducing the mismatch between content and audience. On Meta Feed, you are often reaching broader audiences with weaker pre-qualification, which suppresses average hook rates. This means a “below average” Meta hook rate of 20% may still be outperforming a “good” TikTok hook rate of 22% on an absolute conversion basis if audience quality differs.
What a “Good” Hook Rate Actually Means
Industry practitioners commonly report that the top quartile of Meta video ads achieves hook rates above 35%, while the median sits in the 20–28% range depending on vertical and audience targeting. TikTok’s Creative Center top-performing ads database shows that the highest-hook creative consistently features bold typography in frame zero, faces within the first 1.5 seconds, or immediate motion against a contrasting background.
For YouTube non-skippable bumper ads (6 seconds), hook rate is effectively 100% by design — the metric to optimize there is hold rate through the full duration. For skippable in-stream, the 5-second window before the skip button appears functions as a forced hook test: everything that happens before second 5 determines whether the viewer elects to watch the remainder.
Vertical Industry Benchmarks
Published industry data and platform research suggest hook rates vary substantially by vertical. E-commerce and direct-to-consumer brands — especially those in fashion, beauty, and food — tend to achieve higher hook rates because their products are visually immediate. SaaS and B2B brands typically see lower hook rates (often 10–20% on Meta) because their value propositions require more context to land visually in the first 3 seconds. Education and coaching brands sit in the middle, with hook rates that respond strongly to the presence of a recognizable face making a direct-to-camera statement.
Hold Rate Benchmarks by Platform (2026)
Hold rate is measured as a percentage of viewers who passed the hook (3-second threshold) and then continued to each subsequent milestone. The benchmarks below represent the share of hooked viewers still watching at each checkpoint, not the share of total impressions. This distinction matters: these are retention figures for your already-engaged audience, not conversion rates from cold impressions.
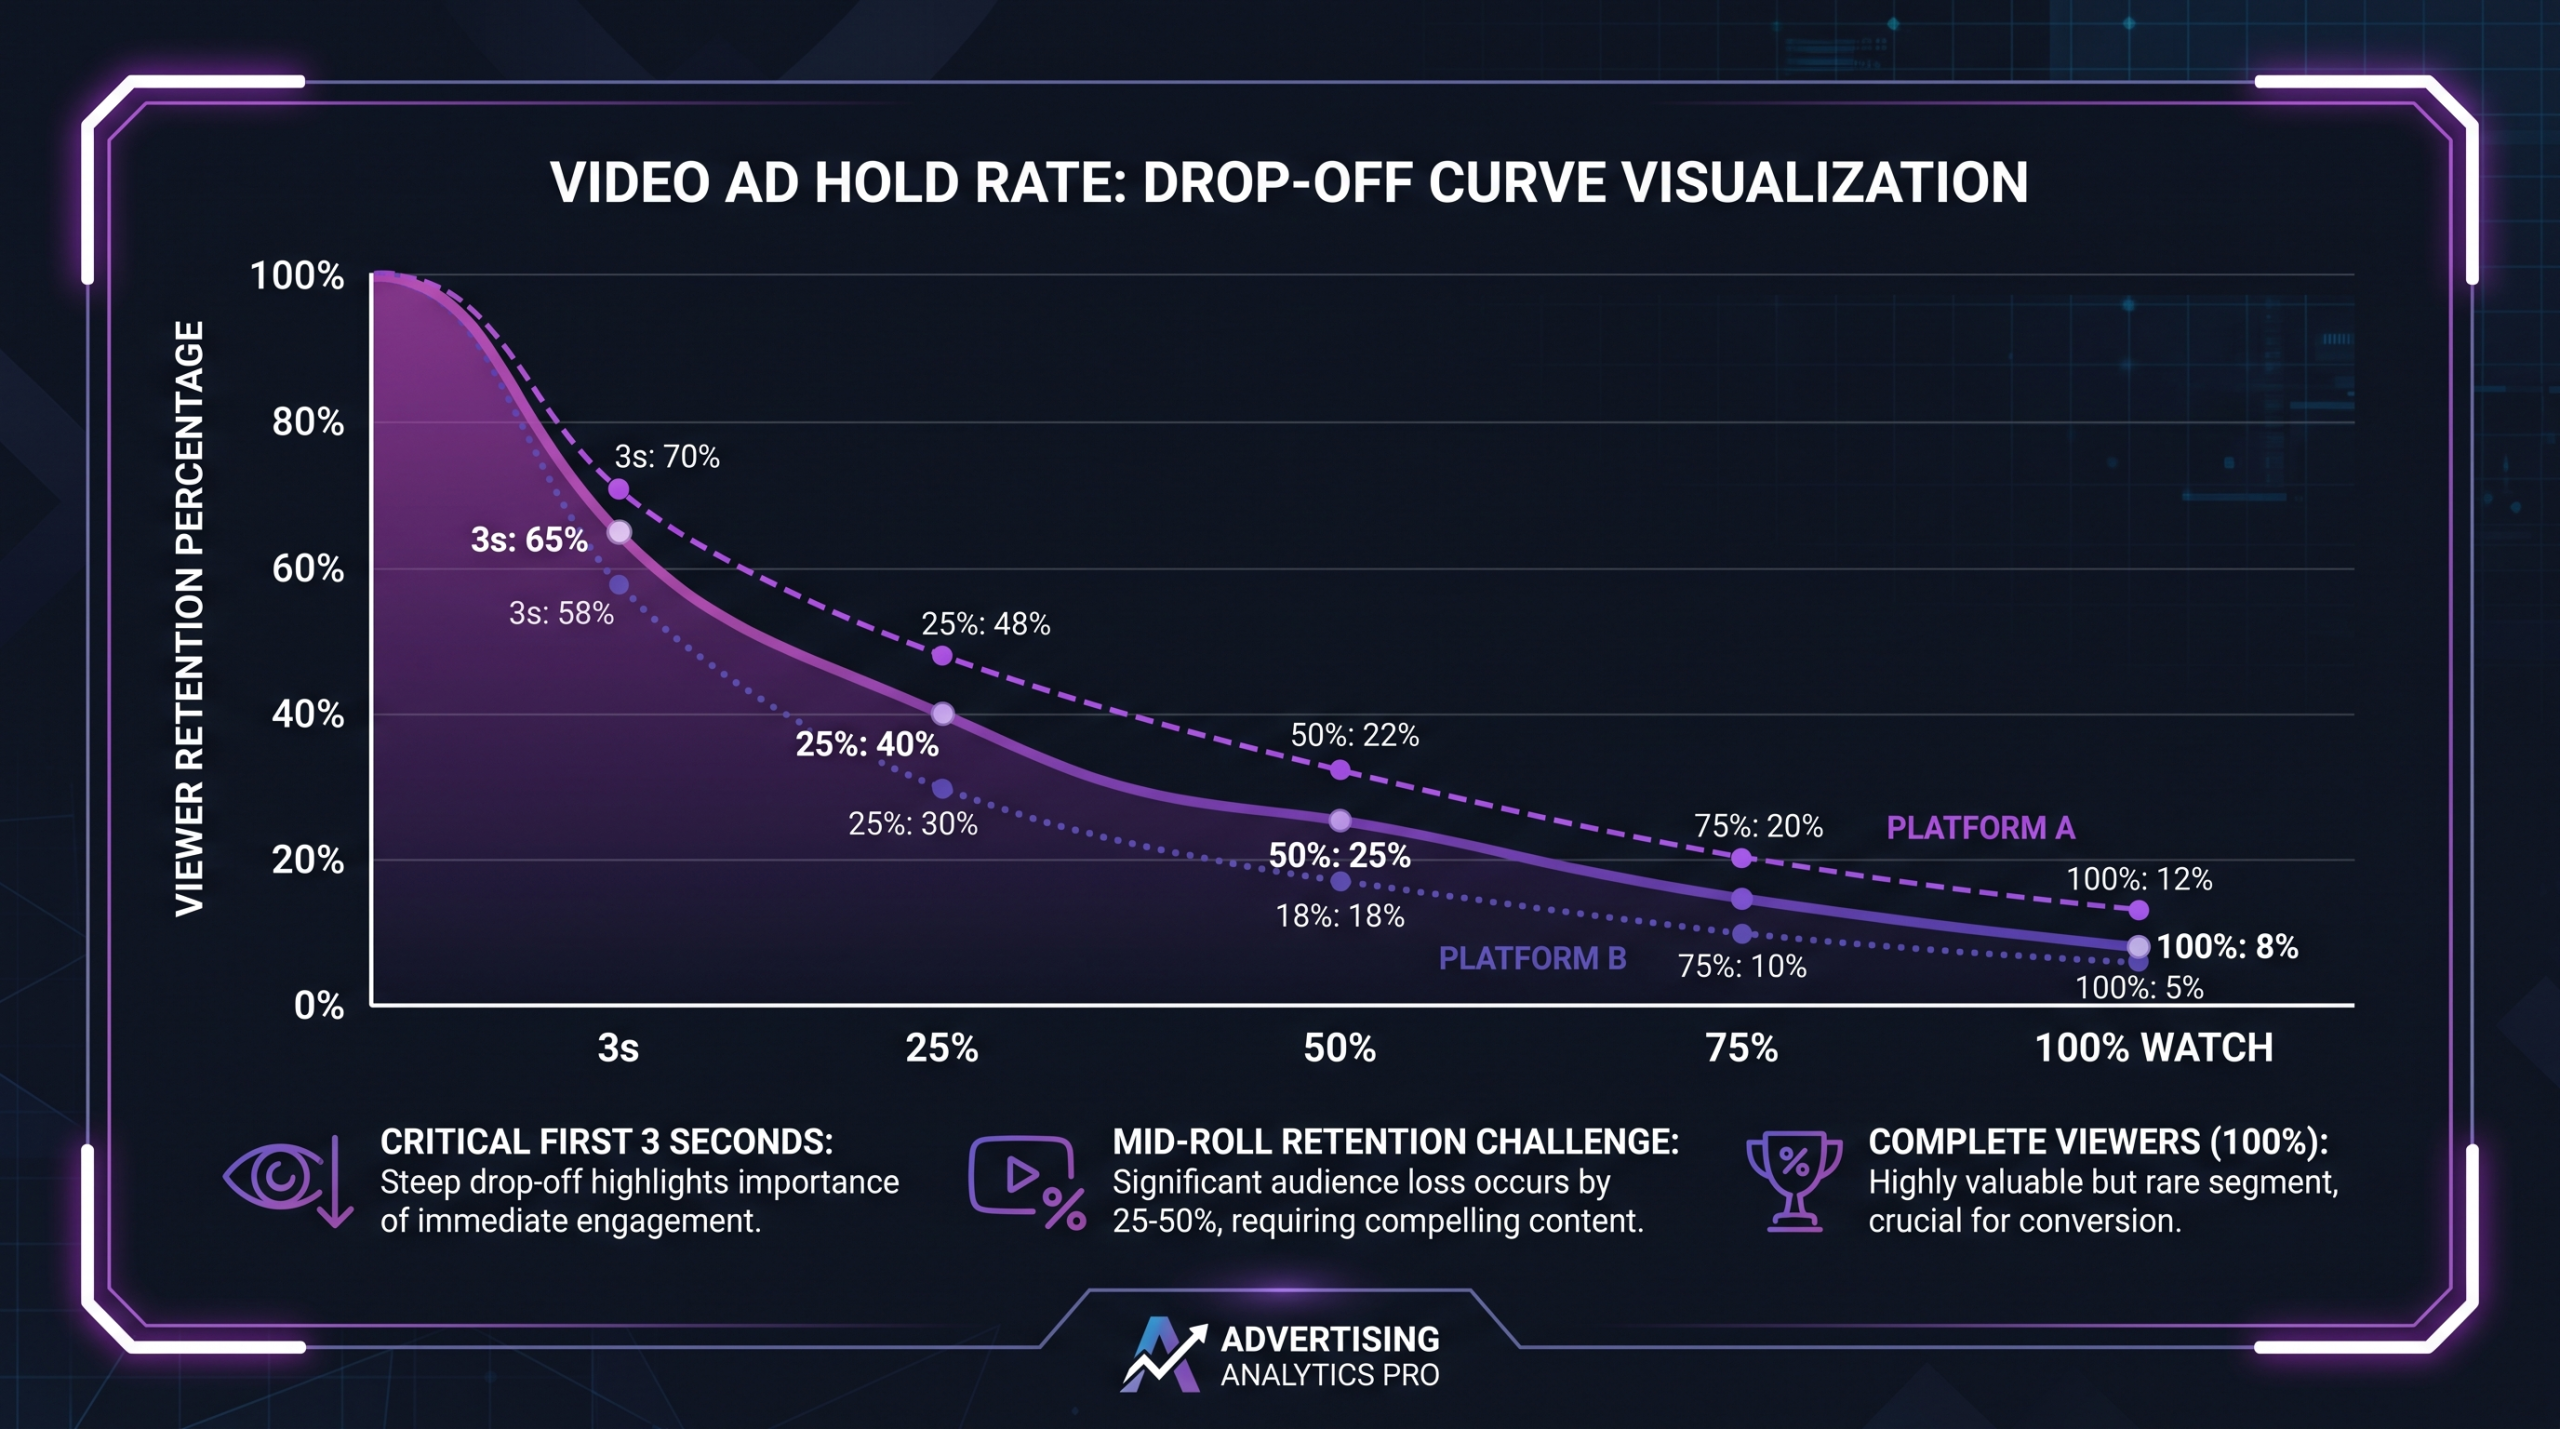
These ranges are based on aggregated industry benchmarks and published reports from platforms and research firms including Wyzowl’s annual video marketing statistics and platform-published creative effectiveness guides. They represent 15-second ads; hold rate ranges compress significantly for 30-second formats, where full-view completion rates often fall to single digits across all platforms for non-skippable formats.
The Critical 6–12 Second Window
The steepest hold rate decline on every platform occurs between the 3-second hook point and the 12-second mark — roughly the 25% threshold for a 15-second ad and the 33% threshold for a 30-second ad. This is the window where viewer intent is lowest: the hook was enough to pause the scroll, but the follow-through has not yet earned continued attention.
Creative teams that understand this curve structure their ads accordingly: the hook occupies seconds 0–3, a secondary value signal or open loop occupies seconds 3–8, and the core message runs from second 8 through the CTA. This three-act compression is visible in the top-performing ads on every platform when you run retention analytics on your own creative library.
How to Diagnose Hook vs. Hold Problems
Before you change anything about your creative, you need to correctly identify which metric is underperforming. Applying hook-rate fixes to a hold-rate problem wastes time and media budget, and vice versa. The diagnostic framework below works for Meta, TikTok, YouTube, and LinkedIn ads.
Diagnostic Step 1: Pull Your Funnel Data
Export the following for each ad creative over the same date range and audience: Impressions, 3-Second Video Views (or equivalent), Video Plays at 25%, 50%, 75%, and 100%, and Click-Through Rate. Calculate your hook rate (3s views ÷ impressions) and hold rates at each milestone (25% plays ÷ 3s views, and so on). You now have your retention curve.
Diagnostic Step 2: Identify the Bottleneck
Compare your hook rate to the platform benchmarks above. If your hook rate is below the lower bound for your platform (e.g., below 25% on Meta Feed), you have a hook problem — your first 3 seconds are losing the audience before they register any message. Do not focus on hold rate until hook rate is addressed; there is no point optimizing retention for an audience that never enters the funnel.
If your hook rate is within or above benchmark range but your 25% hold rate is significantly below the benchmark, you have a hold problem — the opening is working, but the follow-through is losing viewers before they reach the CTA. If both hook and hold metrics are within benchmark range but CTR and conversion remain low, the problem is likely audience targeting or the CTA itself, not the video structure.
💡 Agency Insight: The most common misdiagnosis teams make is spending weeks on hook-rate creative testing when their actual problem is a 25%-to-50% hold rate collapse — meaning viewers are watching past the hook but abandoning before the CTA. Check your hold rate curve before briefing a new creative round. A sharp drop between 25% and 50% is a pacing and narrative problem, not an attention problem.
Reading the Retention Curve Shape
Four distinct retention curve shapes appear in video ad data, each with a different diagnosis:
Steep early drop (cliff after 3s): Hook rate is acceptable but 25% hold rate collapses below 40% of hooked viewers. The opening earned attention but the next moment failed to justify continued viewing. Fix: strengthen the secondary hook at 3–6 seconds.
Gradual linear decline: Relatively balanced drop at each milestone. This is normal for longer-form ads (30–60 seconds). Each subsequent section is losing roughly equal proportions. Optimize the lowest-performing section first — usually the section just before the CTA.
Flat middle, drop at end: Strong hook, strong early retention, then a cliff approaching the CTA. The creative is engaging but the CTA delivery is jarring or feels disconnected from the content. Fix: smooth the transition into the CTA or move the CTA earlier.
Flat hold throughout (high completion): Rare and excellent. This indicates strong creative-audience fit throughout the duration. Prioritize scaling this creative before testing new concepts.
How to Improve Hook Rate
Hook rate improvements live in the first 3 seconds of your video. Every creative choice in that window either earns attention or surrenders it. The following tactics are drawn from patterns in top-performing ad creative across Meta, TikTok, and YouTube, consistent with published findings from platform-side research teams.
1. Lead With Motion, Not Context
Static or slow-moving openings are the single most common cause of below-benchmark hook rates in feed placements (Meta, Instagram, LinkedIn). The viewer’s thumb is looking for a reason to stop. Dynamic motion — a quick cut, zoom, product reveal, or person entering frame — registers faster than a logo or a brand establishing shot.
On sound-off platforms (Meta Feed, Instagram Feed), pair the motion with a bold text overlay that states your core premise in 5 words or fewer. “Stop losing ad budget on bad edits” is more hook-effective than a product shot with no on-screen text, even if the voiceover says the same words — because most viewers in feed positions are watching without audio.
2. Use Pattern Interrupts Immediately
A pattern interrupt is any creative choice that is visually or audibly unexpected relative to the surrounding content. On TikTok and Instagram Reels, where the surrounding content is predominantly user-generated video, highly polished ad creative can actually underperform because it reads immediately as an ad and triggers the skip reflex. Native-format creative — shot vertically on mobile, with ambient audio and casual pacing — achieves higher hook rates in these environments by matching the viewer’s expectation of the feed.
On YouTube, where the surrounding context is professional content, a high-energy cold open performs better as a pattern interrupt because the viewer’s default expectation is a more moderate presentation.
3. Put a Face in Frame Zero
Published research consistently shows that human faces — particularly faces making direct eye contact with the camera — generate stronger initial attention than product shots or text-only openings across all demographics. The face does not need to be a celebrity or even a recognizable brand representative. What matters is direct gaze and legible emotion in the first frame.
For B2B advertisers on LinkedIn, a spokesperson opening with a specific, credible claim — “We audited 200 video ad campaigns and found one pattern” — outperforms product-centric openings because it matches professional browsing intent and creates immediate informational relevance.
4. State the Payoff in the Hook
Viewers stay when they know what they are staying for. A hook that teases a specific, concrete payoff — “Here is why your Meta hook rate is below 20%” — converts better than a generic hook — “Are you making these ad mistakes?” — because the specific hook attracts the right audience and repels the wrong one. Counterintuitively, a more specific hook often raises overall hook rate by reducing the impression pool to pre-qualified viewers before the 3-second mark.
How to Improve Hold Rate
Hold rate is fundamentally a narrative and pacing problem. Once a viewer has passed the hook, they are evaluating whether the rest of the video will deliver on what the hook promised. Every second of content that does not advance the promise — or create a new reason to keep watching — reduces hold rate.
1. Eliminate Dead Seconds
In video ad editing, a “dead second” is any moment where nothing new enters the viewer’s information stream: no new visual element, no new claim, no new audio layer. Dead seconds are the leading cause of post-hook drop-off and they often arise from pacing conventions borrowed from long-form content — establishing shots, slow b-roll, extended logo reveals — that do not translate to the compressed attention economy of paid social.
A working rule for social video ads: every 2–3 seconds should introduce a new visual element, caption, or information beat. This does not mean hyperactive jump cuts — it means deliberate, tight editing that ensures the viewer always has something new arriving before they think to scroll away.
2. Use Open Loops Strategically
An open loop is an unanswered question that creates forward tension. It is one of the most reliable hold-rate tools in video advertising. The technique: introduce a question or claim in the hook, withhold the resolution, and let that unresolved tension carry the viewer forward until the answer arrives — ideally just before the CTA. “The one edit change that tripled our client’s ROAS — we will show you in 30 seconds” is a structural open loop. The viewer stays because the payoff is promised and specific.
The risk is over-use: if every ad in your library leads with a cliffhanger open loop, audiences on saturated platforms (especially TikTok) recognize the pattern and skip before the payoff. Rotate between direct-claim hooks, problem-statement hooks, and open-loop hooks to maintain creative freshness across retargeting audiences.
3. Match Edit Rhythm to Platform and Audience
Hold rate is sensitive to edit rhythm in ways that are not always obvious from a script review. A 15-second TikTok ad with 12 cuts holds better than a 15-second TikTok ad with 4 cuts because the platform has trained its audience to expect frequent visual change. The same ad on LinkedIn — where the audience is in a professional information-seeking mode — may perform better with a more measured 5–6 cut structure and longer camera holds on the speaker’s face or data visualization.
This is one of the reasons that winning a high hold rate across multiple platforms requires platform-specific editing, not a single master file repurposed everywhere. A video editing agency that understands platform-specific hold rate dynamics will produce four distinct edit rhythms from the same raw footage — rather than one file reformatted into four aspect ratios.
4. Align CTA Timing With Your Completion Curve
The CTA should arrive at the point on your hold rate curve where you still have a meaningful share of engaged viewers — not at the very end of the video where only the most committed viewers remain. For a 15-second ad with a typical hold rate curve, placing the CTA between 10–13 seconds (rather than at second 15) often captures a larger active viewer pool. For a 30-second ad, the 20–25 second mark is frequently more effective than saving the CTA for the final frame.
This is counterintuitive because most creative briefs instinctively place the CTA “at the end” — a convention borrowed from long-form content where audience retention is much higher throughout. In video ads, front-loading value and placing the CTA while you still have audience is a structurally superior approach on every platform with an accelerating drop-off curve.
Understanding how much professional video editing costs versus what you gain in hold rate improvements from expert post-production is a calculation worth making explicitly — because the editing investment is typically small relative to the media spend it is optimizing.
Platform-Specific Hook and Hold Strategy
Generic creative strategy advice does not survive contact with platform-specific audience behavior. Each major ad platform has distinct audience expectations, viewing contexts, and algorithm signals that require different creative approaches to achieve above-benchmark hook and hold rates.
Meta (Facebook and Instagram Feed)
Meta’s algorithm uses 3-second video view rate as a direct input to creative quality scoring — ads that consistently achieve above-median hook rates receive favorable auction treatment, reducing CPM over time. This makes hook rate on Meta doubly important: it drives both audience reach and cost efficiency. Optimize for sound-off viewing with bold text overlays; test square (1:1) and vertical (4:5) formats against widescreen before assuming widescreen is optimal.
Meta’s own Business Help documentation on video ad best practices recommends placing the most important brand messaging in the first 3 seconds — before the viewer has elected to expand the video or enable audio. This recommendation is driven by their internal data on viewing patterns across billions of video ad impressions.
TikTok
TikTok’s strength is algorithm-matched delivery — the platform pre-qualifies your audience by interest before serving the ad, which structurally elevates hook rates relative to broad-targeting platforms. The trade-off is that TikTok audiences have extremely high creative fatigue thresholds: they expect genuine entertainment value, not just product-forward messaging. Brands that achieve the highest hook rates on TikTok are those whose ads are genuinely indistinguishable from organic content in format, pacing, and tone.
TikTok’s published Creative Center top ads data consistently shows that the top 10% of hook-performing ads open with sound-first hooks — a line of dialogue, a sound effect, or music drop — rather than a visual-first approach. This reflects TikTok’s default sound-on viewing behavior, which inverts the Meta playbook.
YouTube
YouTube’s skippable in-stream format creates a mandatory 5-second test before the viewer can elect to skip. This changes the hold rate calculus significantly: the benchmark 25% hold rate on YouTube is measured from viewers who chose NOT to skip — a self-selected group of genuinely interested viewers. This means YouTube hold rates after the skip gate are generally higher than Meta hold rates on a per-viewer basis, because the audience is pre-filtered.
Strategy: optimize seconds 0–5 specifically for skip resistance (a curiosity gap or specific claim), then optimize seconds 5–30 for hold. Use the first 5 seconds to earn the right to continue; use the following 25 to deliver the message. YouTube-specific video editing best practices differ substantially from those of short-form social platforms in terms of pacing and narrative arc.
LinkedIn’s lower hook rate ceiling (15–25%) reflects professional browsing intent rather than entertainment intent — users are less likely to pause a scroll for a visually stimulating open because they are reading and evaluating information, not consuming media. The hook tactics that work on LinkedIn are informational: a bold industry stat in frame zero (“B2B video ads average a 2.6% CTR — here is what the top 10% do differently”) or a direct-camera problem statement from a credible source.
LinkedIn’s hold rate advantage is that its audience — when hooked — is far more willing to engage with longer-form content than TikTok or Meta audiences. Published data from LinkedIn Marketing Solutions indicates that B2B video ads under 30 seconds in Sponsored Content placements outperform longer formats on cost-per-lead, but 30–90 second formats outperform on brand recall and consideration metrics.
The Role of Post-Production in Cross-Platform Performance
The teams at Increditors, a video editing agency specializing in performance-driven video post-production, consistently see one pattern across client campaigns: brands that treat video ads as a production line — shoot once, reformat four times — structurally underperform brands that brief each platform’s edit separately, even when the raw footage is identical. The delta is in edit rhythm, text overlay timing, audio design, and CTA placement — all of which are post-production decisions, not production decisions.
Consumer behavior research from Nielsen’s advertising insights division supports this view: creative quality accounts for a substantial share of ad effectiveness variance — larger than targeting, reach, or media placement choices in their reported analyses. Investing in platform-specific post-production is one of the highest-leverage improvements available to video advertisers, because it multiplies the effectiveness of every media dollar already being spent.
Frequently Asked Questions
What is a good hook rate for Facebook video ads?
Industry benchmarks suggest a good hook rate for Meta Feed video ads falls in the 25–40% range, meaning 25–40 out of every 100 impressions result in at least a 3-second view. Top-quartile performers commonly achieve above 35%. Rates below 20% indicate a hook problem worth addressing before scaling ad spend. These benchmarks vary by vertical: e-commerce brands typically achieve higher rates than B2B/SaaS brands on the same placement.
How is hook rate different from video view rate?
Video view rate (VVR) typically measures the percentage of impressions that result in a full or threshold view (often defined as 15 seconds or 30 seconds, depending on the platform’s definition). Hook rate specifically measures the 3-second threshold — the point of initial engagement rather than sustained engagement. A video can have a strong hook rate but a poor VVR if it grabs attention but loses viewers quickly. Both metrics are necessary to understand the full drop-off curve.
What causes a low hold rate after a good hook?
The most common causes are: dead seconds with no new visual or information stimulus in the 3–8 second window, a mismatch between what the hook promised and what the video delivers, pacing that is too slow for the platform’s viewing context, or a CTA that arrives too late after most viewers have already departed. The 3–12 second window is the highest-risk zone for hold rate loss, and it is the first place to examine when hold rate falls below benchmark.
Should I optimize for hook rate or hold rate first?
Always optimize hook rate before hold rate. Hold rate measures retention among viewers who passed the hook — if your hook rate is below benchmark, you have a small and potentially unrepresentative viewer pool, making hold rate data unreliable and optimization premature. Once hook rate is at or above benchmark for your platform, shift focus to the hold rate curve. The sequence is: hook → hold → CTA conversion.
How often should I refresh creative to maintain hook rate?
Creative fatigue on paid social platforms typically begins to show in hook rate data within 4–8 weeks of sustained impression delivery to the same audience, though this varies substantially by platform, audience size, and frequency. Teams commonly see a 15–30% decline in hook rate from campaign launch to the point at which creative fatigue becomes material. Monitoring frequency alongside hook rate — and refreshing creative before frequency exceeds 3–4 per week for the same audience — is the standard practice reported by performance marketing teams managing ongoing video ad programs.
Verdict
Hook rate and hold rate are not abstract metrics — they are direct measurements of whether your video creative is earning attention or wasting media budget. The platform benchmarks in this guide give you a baseline for calibrating your own account performance: if your Meta hook rate is below 25%, you have a demonstrable creative problem in the first 3 seconds. If your hold rate collapses below the 25% milestone, you have a pacing or narrative problem in the 3–12 second window that no amount of targeting optimization will fix.
The most important practical insight from the data: hook and hold problems are post-production problems. They are solved through edit rhythm, text overlay timing, audio design, pacing decisions, and CTA placement — not through additional media spend or different targeting parameters. Brands that diagnose their performance bottleneck correctly and invest in fixing it at the creative production level typically see compounding improvements across their entire paid video program, because every new campaign starts from a higher creative baseline.
Use this guide’s diagnostic framework before your next creative brief. Pull your retention curve, identify whether you have a hook or hold problem, and apply the platform-specific tactics relevant to your primary channel. The benchmarks are orientation — your own historical data is the ground truth, and improving against your own baseline is always the right first objective.
Ready for Video That Actually Converts?
Tell us about your project and we will put together a custom plan.